An Analytics account is your gateway to Analytics. An account can include multiple properties and property types, but a property can belong to only one Analytics account.
A property lives within an account. Properties are the containers for your reports based on the data you collect from your apps and sites. It’s the level at which Analytics processes data and where Analytics can connect with other Google products, like Google Ads.
A data stream lives within a property and is the source of data from your app or website. A property can have one or many data streams.
When structuring your Analytics account, remember this guiding principle: Each property should represent a specific user base.
Use separate properties to collect data from each user base you’re interested in understanding better — for example, a specific brand or region.
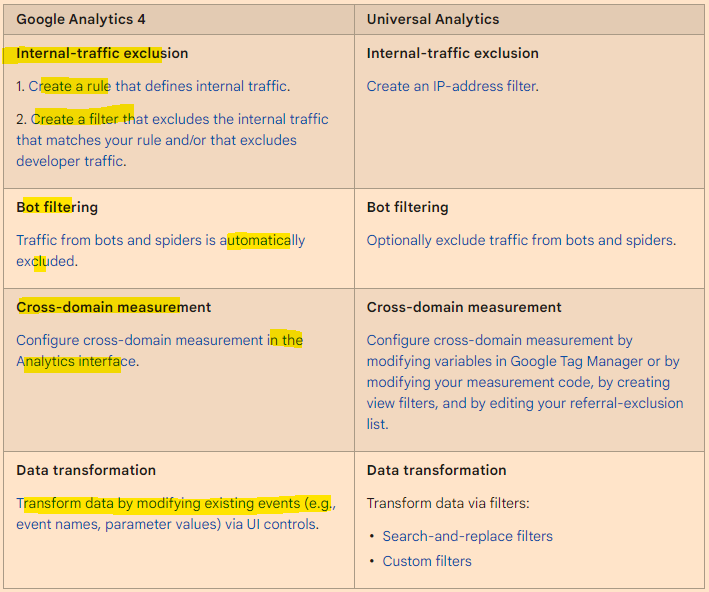
The new version of Google Analytics – Google Analytics 4 – has less pre-made reports and users are prompted to customise their own dashboards and use the search function.
You can literally ask questions, using the search bar. Which is fun.
Instead of pageviews and sessions, GA 4 is built around events.
Pre-configured reports are limited in GA 4. It’s a good idea to have Universal Analytics in addition to GA4
You can’t yet link GA 4 to Search Console
You can Can store raw data in BigQuery
when you install GA4 on your site, the reports don’t import data from GA universal – start from scratch – no historical data is passed over to GA4 when you install it on your site.
GA4 is Built Around Events.
Events:
You can track pageloads, elements clicked, product details, and loads more
Parameters:
Parameters are info that are sent to GA4 with the events.
Eg. Pageview is sent to GA4 with URL of the page, page title and the referral details
Automatic Events:
First Visit – first time someone visits site (this even populates the new user report too)
Page View – same as normal pageviews
Session Start – new session after 30 mins of inactivity
User Engagement – starts whens someone on your site for at least 10 secs
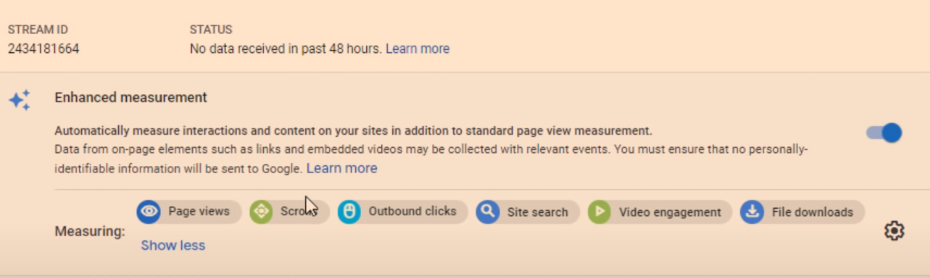
Enhancement Measurement
GA4 automatically tracks:
Scrolls – 90% of a page
Outbound Clicks –
Site Search – search queries
Video Engagement – for embedded YouTube videos
File Downloads
To edit the Enhancement Measurement reports go to “Data Streams” in the Admin area:
Click on data stream and check to see that “Enhanced Measurement” is switched to the on position. If you click on the cog icon, you can then switch different measurements on and off.
They’ll be set to “on” by default.
There are advanced settings for pageviews and site search – just click “Show advanced settings”.
Recommended Events
Google provides a list of recommended events for all websites and apps, and then by industry.
Retail & eCommerce
Jobs, Education, Local Deals & Real Estate
Travel
Games
Custom Events
Custom events allows you to name your events.
Google’s naming convention is probably best to copy – [action]_[object/item]
For example, if you create an event to track when people rate your website, call it:
Rate_item
Instead of
Product-rate
Add parameters such as product, item_id and rating – so you know which product is rated and what rating the user gave it.
You’ll need to register the parameters as custom dimensions or metrics
To make a new event – in the left hand nav/side bar – click –
Events – Create Event – Name the event
Enter the parameters to tell Google when to trigger the new event
E.g. page_location – contains – thank-you
Click “create” in top right corner.
You can create brand new events in Tag Manager – rather than basing them on existing events
Data Settings>Data Retention
By default GA4 only stores data for 2 months – in the Admin area, you can change this to 14 months.
Go to Admin>Data Settings>Data Retention and change it to 14 months on the drop down menu.
Brief Run Down of GA4 Reports (in the left hand side-menu)
REPORTS
Acquisition Reports – Where are visitors coming from? Looks at channels e.g. organic, and New Users Vs Returning Visitors
Click the “+” above the table, to add an additional dimension
1. Click the + above the table on one of the reports:
2. Add an additional dimension to the table, e.g. Page/Screen > Landing Page
Engagement Reports – What are visitors doing on your site?
To see pageviews and users per page:
Reports>Engagement>Pages and Screens
Monetization – New term for eCommerce Reporting in GA 4
See what items people are buying and how much money their spending
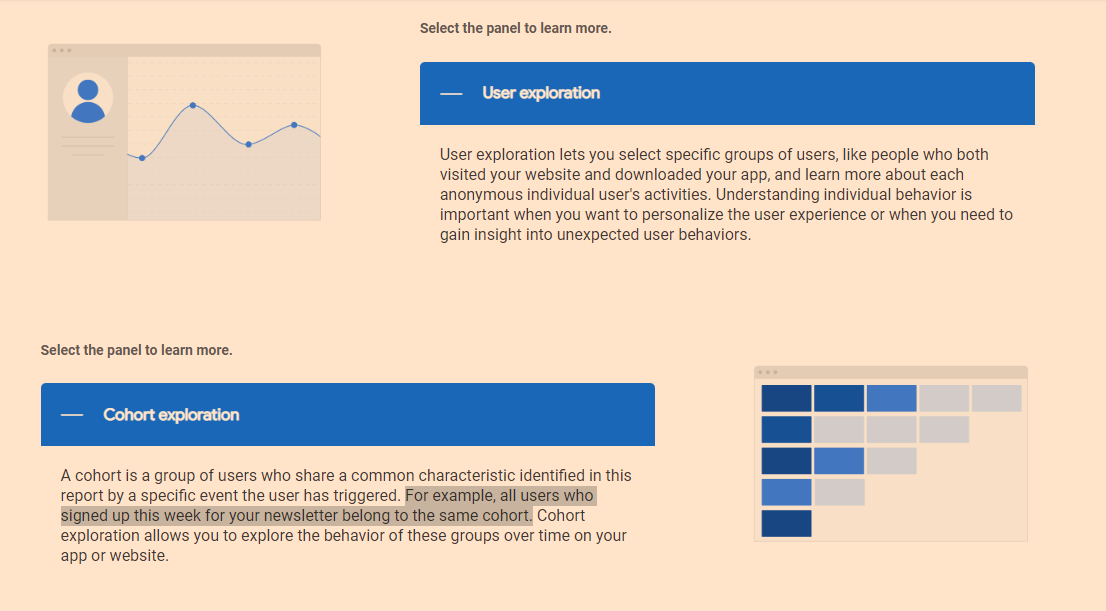
Retention – Looks at new users/visitors and returning visitors. See what percentage of different cohorts come back to the site etc
Demographics – Where are people based and what type of people are coming to your site?
Tech – what computers, tablets and phones are people using?
EVENTS
Conversions – conversions can be customised. But typically include “Begin_checkout” and “purchase”
All Events – basically less important events – compared to conversions. Include clicks, scrolls etc.
EXPLORE
Analysis – There is a Template Gallery (top right of screen)
You can look into funnels, acquisition etc and get cool reports
CONFIGURE
Audiences – you can build different audiences by location, device etc and analyse them
Remember, a property is the container for your reports based on the data you collect from your apps and sites.
A data stream lives within a property and is a source of data from your app or website.
Once you’ve identified a user base you’re trying to measure, create a property for that user base.
Then create a data stream for each of the ways these users interact with your business. For example, if you’re an app developer, you could create one data stream for your iOS app, one for your Android app, and one for your app’s marketing website.
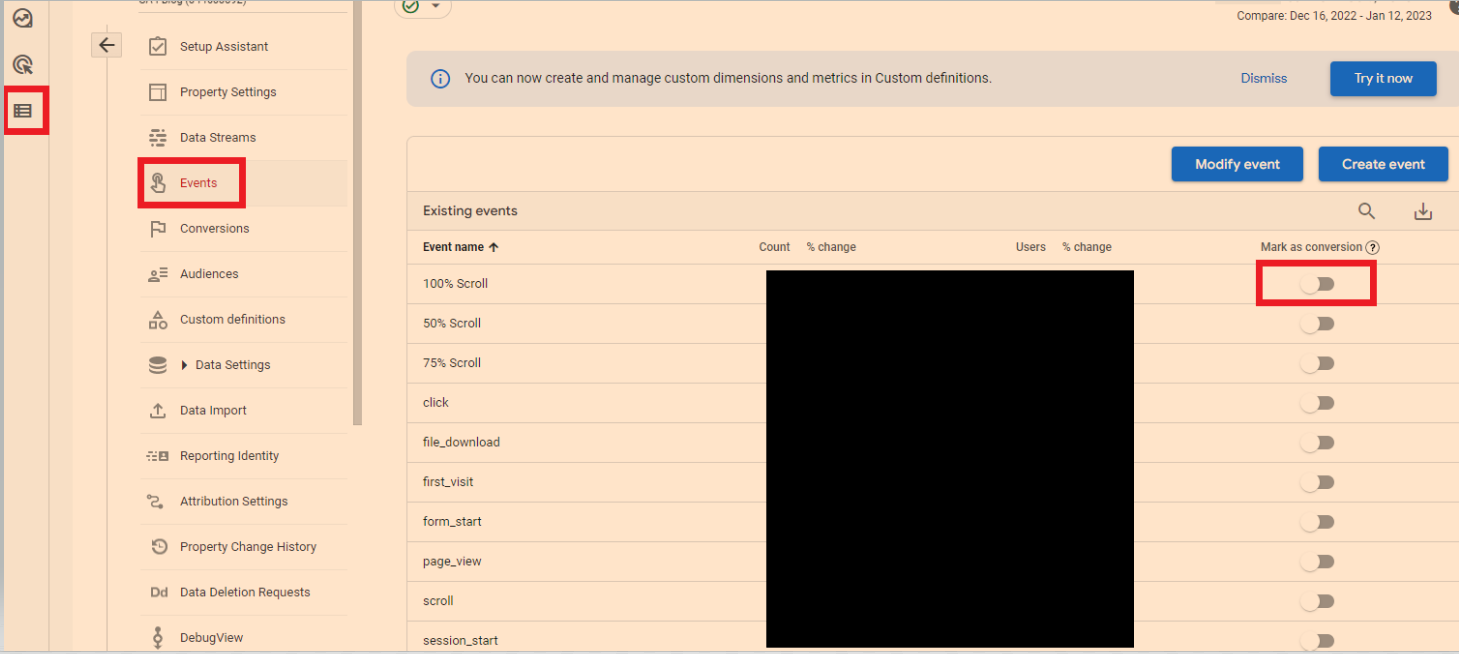
Conversions are events that are assigned a value – such as a purchase, a lead or a download.
To mark events as conversions
In the left-hand side-menu, go to the bottom option “configure” – then “go to admin”
Click “events”
You can now turn on events like 100% scroll, to conversions.
Modelled Conversions
Browsers that don’t allow conversions to be measured with third-party cookies have conversions modeled based on a website’s traffic. Browsers that limit the time window for first-party cookies have conversions (beyond the window) modeled.
Some countries require consent to use cookies for advertising activities. When advertisers use consent mode, conversions are modeled for unconsented users.
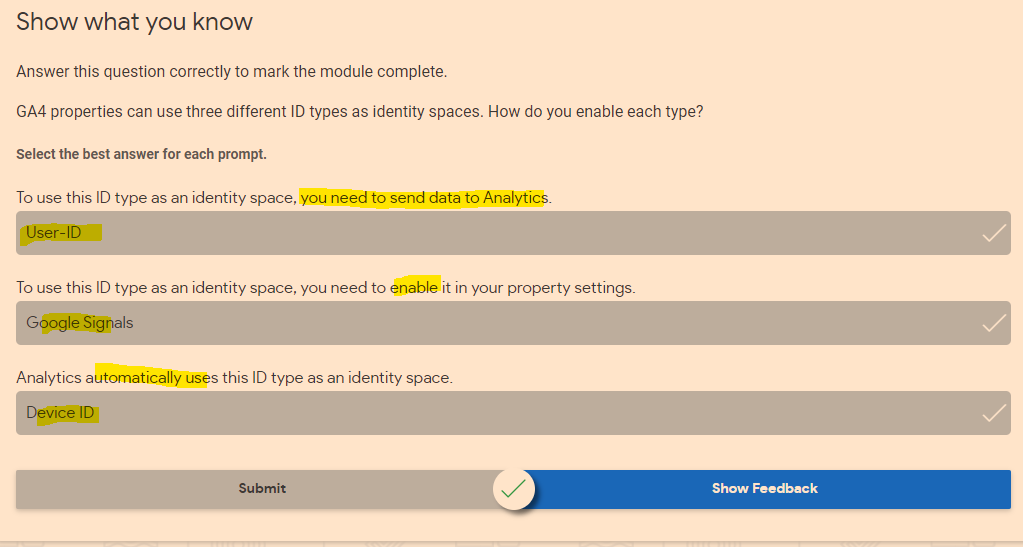
When trying to understand user journeys, Analytics can use several different user identifiers, such as the IDs you assign users logged into your website, Google signals, and device ID. These groups of identifiers are called identity spaces.
Reports & Explorations
Free From Exploration
The free form exploration allows you to visualize your data with flexibility and ease.
To conduct an ad hoc analysis, just drag and drop the variables you’re interested in onto a canvas to see instant visualizations of your data. Don’t see the variable you’re looking for? Select the plus icon to view the full list of dimensions and metrics you can use.
This tool presents your data in a cross-tab layout, where you can arrange the rows and columns as you like and add the metrics you’re most interested in. You can also apply different visualization styles, including bar charts, pie charts, line charts, scatter plots, and maps.
If you spot a significant data point, right-click on that data point to easily create an audience or segment from it and use it in other explorations. If you use the line chart visualization, you’ll see an automatic feature enabled called anomaly detection. This feature uses machine learning to identify outliers in your data according to your parameters.
Funnel Exploration
Funnel exploration lets you visualize the steps your users take toward a key task or conversion. This tool helps you identify sequences of key events and understand how your users navigate these steps. You’ll be able to see where users enter your funnels, as well as where they drop off.
You can use this information to improve your site or app and reduce inefficient or abandoned customer journeys. You can also easily create audiences of users based on where they enter or exit the funnels you define.
With this tool, you can define up to 10 steps in your funnels, up from five steps in UA properties’ Custom Funnels. Plus, you can now analyze both closed funnels (where users must enter at the beginning of the funnel) and open funnels (where users can enter the funnel at any point).
Path Exploration
Path exploration lets you understand how people progress from one stage in the customer journey to the next.
Like funnel exploration, path exploration uncovers the steps users take through your site or app. But while funnels only analyze a single, predefined path, path exploration is free-flowing and can follow any number of undefined paths, even ones you weren’t aware of or didn’t intend. For example, it could uncover looping behavior, which may indicate users becoming stuck.
Plus, you can define paths using either a starting point or an ending point. This helps you understand how users got to a certain step on their journey and shows you what they did after.
Segment Overlap
Segment overlap lets you compare up to three user segments to quickly see how those segments overlap and relate to each other. This can help you isolate specific audiences based on complex conditions. You can then create new segments based on your findings, which you can apply to other exploration techniques and Google Analytics reports.
Explorations are private by default. If you’re the creator, only you can view and edit them unless you choose to share.
Understand the Analytics property structure
You can use GA4 properties exclusively for web data, exclusively for app data, or for both app and web data together. No matter what your setup is, it’s important to understand how to structure your new Analytics property.
Introducing data streams
Data streams are a feature of GA4 properties that allow you to connect a single Analytics property to the various places where your users interact with your business. For example, a company that has both a website and an app would need a separate data stream for each platform to combine their reporting and insights into a single Analytics property.
Once you have set up your GA4 property and data stream(s), you can add different events.
For an eCommerce store, Google recommends setting up:
Google Analytics 4 filters are applied at the property level, and affect data from all data streams in that property. All reports for a property use the same filtered data.
Analytics collects and stores user interactions with your website or your app as events. Events provide insight into what’s happening on your website or app, such as page views, button clicks, user actions, or system events.
Conversions
It’s easy to create conversions, from events.
Got to EVENTS in the side-bar/menu on the left of GA4, then “All events”.
You can then mark existing events as conversions:
See also:
GA 4 SEO Reports – for step by step instructions on setting up some useful SEO reports in Google Analytics 4
There are a few ways to blend data, here’s my fave:
Go to “Resources” in the main menu at the top
Click “manage blended data” option
Click “Add a Data View”
Choose a Data Source e.g. Search Console
Then “Add a Table” and include another data Source for blending – e.g. GA or click “blend data” on an existing table or chart – and select another data source
Choose a common “key” to both data sources e.g. “Date”
Choose the metrics you want from each Data Source – I wanted to get daily revenue into my search console reports:
Using the blended data above, I can now add Revenue from Google Analytics to my search console reports. I have to remember however, that the revenue is simply attributed to each day and not any queries
**Update to the screenshot –
add a table filter to get organic only revenue from GA.
To be able to filter Revenue to organic only – you need to add a “Dimension” to the table on the right – click the “+” next to “Add dimension” in the GA data and then “Default Channel Grouping” – you can then create a filter in the report:
Blending Search Console Data in Data Studio
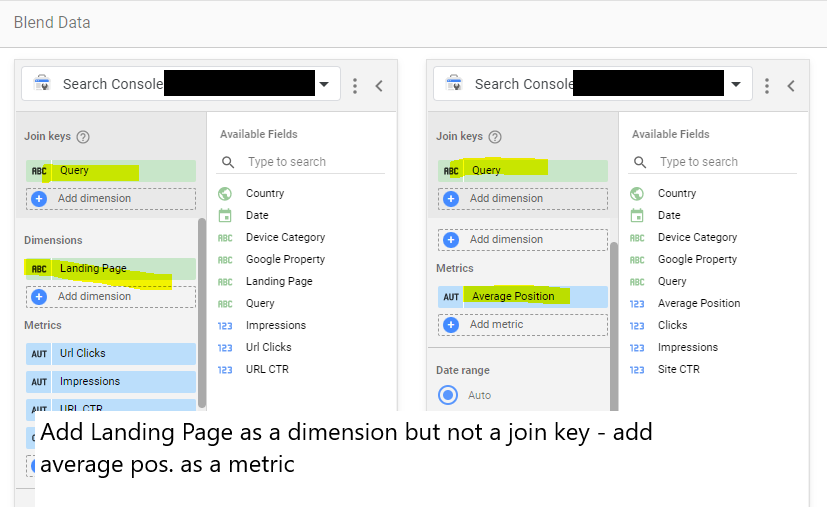
Another common reason to blend data – is to get average position data from Search Console “Site Impression reports, added to “URL Impression” data:
URL impression vs site impression
Incidentally –
the main difference between Data Studio Search Console URL Impression Vs Site Impression data – is that Site Impression contains the Average Position metric and URL Impression contains the Landing Page metric. So when you’re blending the data from both sources, make sure you have “Landing Page” as a metric and “Average Position”.
Just use SEMRush – Organic Research – Positions tab and download and pivot the pages data – no need for advanced filter
Once you’ve found the blog posts with the most traffic, you can analyse the “Exact URL” in SEMRush
This analysis, should show you the keywords on the page that generate most of the search traffic
I personally like to go after KWs with a Keyword Difficulty score of less than 20 for my personal blog and under 30 for my employer’s blog
You can also use Reddit & Quora for Content Ideas
Unsolicited #SEO tip: You can get great ideas for specific content ahead of features like PAAs being generated by using Google site operators with specific sites. For instance, I can use the command:
site:reddit[dot]com/r/amateur_boxing “how do i”
or
site:reddit.com/r/bootroom “how do i”
To search just the amateur boxing subreddit for questions starting with “how do I?” You can apply this on any niche or on other sites like Quora to get up to the minute questions people are asking.
I’ve made some notes from a few videos on YouTube – thought I may as well turn it into a blog post…
Summary – Get More Linkedin Followers to Your Business Page
Pay for ads to get up to 1,000 followers to begin with
Get employees to like and share
Get employees to create own content & tag company page*
Don’t post too many links (links kill reach)
Don’t post about the company all the time – where’s the value?
Do post useful content that helps target audience – provide value
Engage in relevant groups
Post videos with transcripts – upload direct to Linkedin
Reuse videos that are under 1 minute long for YouTube Shorts
Super-admin – can invite up to 100 members per month
Tag customers and other businesses in your post
Share and comment on trending topics/news
The higher up in the business an employee is, the more engagement it will tend to get if they share company posts**
*Employees could create videos, shares quotes etc. doesn’t have to be perfect and professional, as it’s the user’s content not the company’s
**People use Linkedin for networking/brown-nosing, so the more influential a person is, the more engagement they will tend to get
Notes from videos:
Linkedin
Linkedin has the Most potential for organic reach at the moment
Use Linkedin Polls for engagement
Engage and post in relevant Linkedin groups
Don’t overdo self promotion
Find out what target audience are interested in – post about that
Don’t post about your company all of the time
Post 4 to 5 times per week
Post 25% about your service or product – 75% relevant, useful, informative content
Run ads and add the “follow button”
Get employees to engage with content – make sure they optimize their profiles and networks too
Get employees to share the posts on their personal profiles
Invite connections to like the business page (you have to be a page admin)
Define perfect follower/customer persona
Determine the needs of the perfect follower – personal and business life
What is their company/employer’s needs?
Become an authority in the niche by posting informative content that addresses their needs
Get your employees to engage and share posts
Get employees to share but with their own commentary
Get employees to reply to comments on your posts
Don’t just promote the company
Get employees to share their own unique content that is of value and 20% of the time promote your business – and tag company page
Create an industry specific Linkedin group and invite people – link group to company page so you can post as company
In the group create 90% value posts and 10% promotional posts
Linkedin Ads – target specific people, area, industry, job title etc. – use ads to get 1,000 followers to help organic reach afterwards
Notes from Reading Articles about Getting More Linkedin Followers
– social media platforms, want to be content platforms:
More videos (with in-video transcripts),
Business related Memes/quotes (scannable content, nobody really reads posts on FB or Linkedin)
Publish more posts without links (platforms tend to kill your reach if you link out to other sites, apparently),
– Whilst content that is posted directly to a social media platform will tend to be amplified, if it is hosted externally
e.g. on Youtube, the reach will be killed by the platform – they don’t want people to leave their site/app via links.
create “micro-content” for social media, by turning videos, webinars etc into smaller content e.g. quotes from videos into images and memes, longer videos into 30 second clips with in-video transcripts.
Targeting specific locations? Use search function on Linkedin and Instagram to comment on relevant posts.
Incentivise employee engagement – top 3 people with most likes and shares each month get £100 voucher or some company stash – emphasise it is completely voluntary
Twitter
Use Twitter advanced search to find relevant questions and topics to engage with.
Twitter – find relevant influencers – engaged with (and potentially follow) people who engage with the influencer’s tweets. These people will tend to be relevant and active on Twitter
There is much talk about emotional intelligence and the importance of it, but I rarely see any articles, posts or videos that explain how to develop it.
One thing that I personally think provides a foundation of emotional intelligence, is the ability to ‘detach from one’s thoughts’ – which normally requires a meditation practice. If you can’t stand back and observe your thoughts, it’s very difficult to evaluate their validity.
Physiological Responses & Emotions
Pre Existing Belief Bias
When information contradicts a pre-existing belief, our bodies generate a stress response with cortisol and adrenaline
When we force our opinion on someone, or someone confirms a pre-existing belief, our bodies generate a “dopamine-reward”
Consequences of Pre-Existing Belief Bias
Bullying – e.g. we see someone overweight – we’ve been led to belief as a child this is “wrong” or undesirable, or negative. So we bully the person
We dismiss people as being weird
We mock people with different beliefs
We’re brainwashed into fighting wars against people who oppose our beliefs (pretty heavy stuff!)
Examples of Pre Existing Belief Bias
When a child sees someone that is overweight – they believe people shouldn’t be overweight, so they bully that person
When someone questions if high cholesterol is the cause of heart disease – people think the statement is ridiculous, despite mounting scientific evidence and refuse to comprehend this counter-argument to mainstream ideas.
Cognitive Biases
Self Serving Bias People tend to take credit for things when they go right, but blame others when things go wrong. People may also exaggerate what the do right and exaggerate what others do wrong. A classic example, is housework – both individuals in a marriage often over-estimate their own contribution to housework and underestimate their partner’s contribution
Confirmation Bias Reaffirming an existing belief by looking for information that confirms it. For example, if someone believes coconut oil is unhealthy because of the high saturated fat content – they might search for “why coconut oil is unhealthy?” rather than a more neutral search-term such as “what are the health benefits and health risks associated with coconut oil?”
Confirmation bias and self Serving bias are often intertwined. For example, a mother who doesn’t breastfeed her children, might read about babies losing weight and becoming ill because of not getting enough volume of milk via breastfeeding. The mother globally concludes from this, that breastfeeding is bad.
Global Judgements based on individual or minor observations David may judge Tom for being a boxer – because Tom engages in violence, there is no way he could be a nice person. This is also based on a self serving bias, David is an academic who is not athletic and as a result, will discount the value of anything physical or violent when possible. I’m not sure what the proper phrase is for this type of bias Another example might be that Tim, saw Peter lose his temper once, in 1999. Tim has since then held the belief that Peter has anger management problems.
Cognitive biases are highly prevalent in martial arts. For example, someone that does a traditional martial art, may state that MMA is no good for self defense, as there are too many rules. A boxer may dismiss grappling as “rolling around on the floor” and a grappler may dismiss boxing as ineffective because “most fights end in a grapple” (true, but they also tend to start and end with punches!).
Logical Fallicies
Questioning the messenger instead of the message (Also known as Ad Hominem) You attacked your opponent’s character or personal traits in an attempt to undermine their argument. When someone attacks a person, instead of the person’s opinion. For example, if a vegetarian is wearing leather shoes, whilst debating the morality of vegetarianism, someone might attack the vegetarian for wearing leather shoes. This however, doesn’t address the issue being debated – is vegetarianism more ethical that a diet containing meat-products?
Ad hominem attacks can take the form of overtly attacking somebody, or more subtly casting doubt on their character or personal attributes as a way to discredit their argument. The result of an ad hom attack can be to undermine someone’s case without actually having to engage with it.
Example: After Sally presents an eloquent and compelling case for a more equitable taxation system, Sam asks the audience whether we should believe anything from a woman who isn’t married, was once arrested, and smells a bit weird.
The Strawman Argument Changing the subject being debated half way through a debate. For example, someone might say that lots of sleep isn’t good for you, because depressed people sleep more than happy people. When it is pointed out that scientific evidence shows that too little sleep, might lead to degenerative brain conditions, and give Margaret Thatcher as an example – a strawman counter argument would be to refute this, because Margaret Thatcher achieved so much. Rather than addressing whether or not sleep is good for health, the debate changes to the achievement levels of famous people who are known not to sleep 8 hours or more.
A straw man is a form of argument and an informal fallacy of having the impression of refuting an argument, whereas the proper idea of the argument under discussion was not addressed or properly refuted. One who engages in this fallacy is said to be “attacking a straw man”. Wikipedia
Other Emotional Intelligence Issues
Stooping in arguments One major issue with debates and arguments is the willingness for one person to inflict emotional damage or to stoop more than another person.
For example, in an office environment, where aggression is deemed inappropriate – one debator may resort to aggressiveness, whilst the other person is unwilling to become aggressive, and so let’s the aggressive individual ‘win’ the debate to prevent an esculation. When future conflicts in opinion arise, the more passive individual may not be willing to dispute or discuss anything, due to fear of an aggressive confrontation.
Victim Triad When person X complains to person Y, and person Y gives them sympathy but then person X complains to person Z and is told to look for a solution or that the sitation is not especially bad, person X will often feel like a victim of both the scenario they are complaining about and the lack of sympathy from person Z
Drama Triad If person X ridicules, bullies or is not particularly nice to person Y for a prolonged period of time – eventually person Y retaliates and tells person X to stop. Person X may feel like a victim and engage in vicious gossip about person Y for being in such a bad mood. Person X and person Y feel like victims in this situation.
Emotional Projection Blaming other people for your negative emotions. An individual who is subconsciously (or consciously) deemed as being weak, is usually the subject of another person’s projected emotions.
A few of the above are not directly related to emotional intelligence but an awareness of them could help to foster it, in my opinion.
The idea of technical SEO is to minimise the work of bots when they come to your website to index it on Google and Bing. Look at the build, the crawl and the rendering of the site.
To get started:
Crawl with Screaming Frog with “Text” Rendering – check all the structured data options so you can check schema (under Configuration – Spider – Extraction)
Crawl site with Screaming Frog with “JavaScript” rendering also in a separate or second crawl
Don’t crawl the sitemap.xml
This allows you to compare the JS and HTML crawls to see if JS rendering is required to generate links, copy etc.
Download the sitemap.xml – import into Excel – you can then check sitemap URLs vs crawl URLs.
Check “Issues” report under Bulk Export menu for both crawls
Also download or copy and paste sitemap URLs into Screaming Frog in list mode – check they all result in 200 status
*Great for tailoring copy and pages. Just turn it on and add query parameter
Summary:
– Perform a crawl with Screaming Frog – In Configuration – Crawl – Rendering – Crawl once with Text only and once with JavaScript
Check indexation with site: searches including:
site:example.com -inurl:www
site:*.example.com -inurl:www
site:example.com -inurl:https
– Search screaming frog crawl – for “http:” on the “internal” tab – to find any unsecure URLs
*Use a chrome plug in to disable JS and CSS*
Check pages with JS and CSS disabled – Are all the page elements visible? Do Links work?
Configuration Checks
Check all the prefixes – http, https and www redirect (301) to protocol your using – e.g. https://www.
Does trailing slash added to URL redirect back to original URL structure?
Is there a 404 page?
Robots & Sitemap
Is Robots.txt present?
Is sitemap.xml present? (and in the sitemap)
Is Sitemap Submitted in S.C.?
X-robots present?
Are all the sitemaps naming conventions in lower case?
Are the URLs correct in the sitemap – correct domain and correct URL structure?
Do sitemap URLs all 200? (including images) List Mode in Screaming Frog – “Upload” – Download sitemap – “ok”
For site migrations check – Old sitemap and Crawl Vs New – For example, Magento 1 website sitemap vs Magento 2 – anything missing or added – what are status codes?
– Status Codes – any 404s or redirects in SCreaming Frog crawl?
Rendering Check – Screaming Frog – also check pages with JS and CSS disable. Check links are present and work
Are HTML Links and H1s in the rendered HTML – check URL Inspection in Search Console or Mobile Friendly text?
Do pages work with JS disabled – links and images visible etc?
What hreflang links are present on the site?
Schema – Check all schema reports in Screaming Frog for errors
Sitemap Checks Are crawl URLs missing from the sitemap? (check sitemap Vs crawl URLs that 200 and are “indexable”
Site: scrape How many pages are indexed?
Do all the scraped URLs result in a 200 status code?
H1s Are any duplicate H1s? Are any pages missing H1s? Any multiple H1s?
Images Are any images missing alt text? Are any images too big in terms of KB?
Canonicals Are there any non-indexable canonical URLs?
Are any canonicals canonicalised? e.g. pages with different canonicals that arent simples/config products
URL structure Errors
Meta Descriptions Are any meta descriptions too short? Are anymeta descriptions too long? Are any meta descriptions duplicated?
Meta Titles Are any meta titles too short? Are anymeta titles too long? Are any meta titles duplicated?
Robots tags blocking any important pages?
Menu Is the menu functioning properly?
Pagination Functioning fine for UX? Canonical to root page?
Check all the issues in the issues report in Screaming Frog
PageSpeed Checks Lighthouse – check homepage plus 2 other pages
GTMetrix
pingdom
Manually check homepage, listing page, product page for speed
Dev Tools Checks (advanced) Inspect main elements – are they visible in the inspect window? e.g. right click and inspect the Headings – check has meta title and desc Check on mobile devices Check all the elements result in a 200 – view the Network tab
Console tab – refresh page – what issues are flagged? Unused JS in the elements tab – coverage
other Checks
Has redirect file been put in place? Have hreflang tags for live sites been added? Any meta-refresh redirects!?
Tech SEO 1 – The Website Build & Setup
The website setup – a neglected element of many SEO tech audits.
Storage Do you have enough storage for your website now and in the near future? you can work this out by taking your average page size (times 1.5 to be safe), multiplied by the number of pages and posts, multiplied by 1+growth rate/100
for example, a site with an average page size of 1mb with 500 pages and an annual growth rate of 150%
1mb X 1.5 X 500 X 1.5 = 1125mb of storage required for the year.
You don’t want to be held to ransom by a webhost, because you have gone over your storage limit.
How is your site Logging Data? Before we think about web analytics, think about how your site is storing data. As a minimum, your site should be logging the date, the request, the referrer, the response and the User Agent – this is inline with the W3 Extended Format.
When, what it was, where it came from, how the server responded and whether it was a browser or a bot that came to your site.
Blog Post Publishing Can authors and copywriters add meta titles, descriptions and schema easily? Some websites require a ‘code release’ to allow authors to add a meta description.
Site Maintenance & Updates – Accessibility & Permissions Along with the meta stuff – how much access does each user have to the code and backend of a website? How are permissions built in? This could and probably should be tailored to each team and their skillset.
For example, can an author of a blog post easily compress an image? Can the same author update a menu (often not a good idea) Who can access the server to tune server performance?
Tech SEO 2 – The Crawl
Google Index
Carry out a site: search and check the number of pages compared to a crawl with Screaming Frog.
With a site: search (for example, search in Google for site:businessdaduk.com) – don’t trust the number of pages that Google tells you it has found, scrape the SERPs using Python on Link Clump:
How to scrape Google SERPs in one click – Don’t use LinkClump, use the instructions on my blog post here to make your own SERP extractor
Too many or too few URLs being indexed – both suggest there is a problem.
Correct Files in Place – e.g. Robots.txt Check these files carefully. Google says spaces are not an issue in Robots.txt files, but many coders and SEOers suggest this isn’t the case.
XML sitemaps also need to be correct and in place and submitted to search console. Be careful with the <lastmod> directive, lots of websites have lastmod but don’t update it when they update a page or post.
Response Codes Checking response codes with a browser plugin or Screaming Frog works 99% of the time, but to go next level, try using curl and command line. Curl avoids JS and gives you the response header.
You need to download cURL which can be a ball ache if you need IT’s permission etc.
Anyway, if you do download it and run curl, your response should look like this:
Next enter an incorrect URL and make sure it results in a 404.
Canonical URLs Each ‘resource’ should have a single canonical address.
common causes of canonical issues include – sharing URLs/shortened URLs, tracking URLs and product option parameters.
The best way to check for any canonical issues is to check crawling behaviour and do this by checking log files.
You can check log files and analyse them, with Screaming Frog – the first 1,000 log files can be analysed with the free version (at time of writing).
Most of the time, your host will have your logfiles in the cPanel section, named something like “Raw Access”. The files are normally zipped with gzip, so you might need a piece of software to unzip them or just allow you to open them – although often you can still just drag and drop the files into Screaming Frog.
Lighthouse Use lighthouse, but use in with command line or use it in a browser with no browser add-ons.If you are not into Linux, use pingdom, GTMetrix and Lighthouse, ideally in a browser with no add-ons.
Look out for too much code, but also invalid code. This might include things such as image alt tags, which aren’t marked up properly – some plugins will display the code just as ‘alt’ rather than alt=”blah”
Javascript Despite what Google says, all the SEO professionals that I follow the work of, state that client-side JS is still a site speed problem and potential ranking factor. Only use JS if you need it and use server-side JS.
Use a browser add-on that lets you turn off JS and then check that your site is still full functional.
Schema
Finally, possibly in the wrong place down here – but use Screaming Frog or Deepcrawl to check your schema markup is correct.
You can add schema using the Yoast or Rank Math SEO plugins
The Actual Tech SEO Checklist (Without Waffle)
Basic Setup
Google Analytics, Search Console and Tag Manager all set up
Site Indexation
Sitemap & Robots.txt set up
Check appropriate use of robots tags and x-robots
Check site: search URLs vs crawl
Check internal links pointing to important pages
Check important pages are only 1 or 2 clicks from homepage
For render blocking JS and stuff, there are WordPress plugins like Autoptimize and the W3 Total Cache.
Make sure there are no unnecessary redirects, broken links or other shenanigans going on with status codes. Use Search Console and Screaming Frog to check.
Site UX
Mobile Friendly Test, Site Speed, time to interactive, consistent UX across devices and browsers
Consider adding breadcrumbs with schema markup.
Clean URLs
Image from Blogspot.com
Make sure URLs – Include a keyword, are short – use a dash/hyphen –
Secure Server HTTPS
Use a secure server, and make sure the unsecure version redirects to it
Allow Google to Crawl Resources
Google wants to crawl your external CSS and JS files. Use “Fetch as Google” in Search Console to check what Googlebot sees.
Hreflang Attribute
Check that you are using and implementing hreflang properly.
Tracking – Make Sure Tag Manager & Analytics are Working
Check tracking is working properly. You can check tracking coed is on each webpage with Screaming Frog.
Internal Linking
Make sure your ‘money pages’ or most profitable pages, get the most internal links
Content Audit
Redirect or unpublish thin content that gets zero traffic and has no links. **note on this, I had decent content that had no visits, I updated the H1 with a celebrity’s name and now it’s one of my best performing pages – so it’s not always a good idea to delete zero traffic pages**
Consider combining thin content into an in depth guide or article.
Use search console to see what keywords your content ranks for, what new content you could create (based on those keywords) and where you should point internal links.
Use Google Analytics data regarding internal site searches for keyword and content ideas 💡
Update old content
Fix meta titles and meta description issues – including low CTR
Find & Fix KW cannibalization
Optimize images – compress, alt text, file name
Check proper use of H1 and H2
See what questions etc. are pulled through into the rich snipetts and answer these within content
Click “Pages” (near the bottom-third of the page on the left)
Click on a high-performing post in terms of Impressions and Clicks in google
With the specific page/post selected, click on queries
Make a note of all relevant queries in the top 100
See if these queries can be added to the ranking post
Find any queries that are not directly related to your post
Create a new post specifically about this/these queries (if you rank for it without a specific post – you’ll rank better with a specific post for that query)
In the original post – put an internal link to the new post
“You’ll never get yourself off the treadmill of paid ads, if you don’t build your brand”
Someone on a Search Podcast, 2019
It’s very easy to dismiss online content, blogs, image assets and even display ads as pretty much useless – because you don’t have the instant gratification of seeing leads and/or sales.
This is completely understandable; especially if you have a background in sales – where your job has been to ‘finish off the lead’ and get a sale.
However, if you are in it for the long (or medium) run, then building your brand is a must. Whether you are a tradesman or a giant corporation, your brand’s reputation and the brand-awareness is your safety net when it comes to consistent website traffic, leads & sales.
It takes time to build a brand – but once it is built, those people who come to you direct because they know who you are – are effectively free – or at least very cheap in comparison to some of the cost per click of Google Search Ads these days.
Building a brand is not easy however. Take my other blog for example – Blackbeltwhitehat.com
The blog has over 600 pages of content, lots of it really long, in-depth and time-consuming to produce. The site has 5,000-10,000 visitors per month, but virtually nobody comes to my website via a branded search on Google.
This could be down to one specific reason – the domain name is crap and hard to remember.
I’ve bought a few more memorable domains (like WokeMMA.com “Woke” being an ironic term for self-awareness used in the MMA & Jiu Jitsu communities) and I am currently weighing up the time & effort of re-branding everything like GoogleMyBusiness, TrustPilot etc. – plus all my back-links currently point to blackbeltwhitehat.com (I’m aware of 301s etc. but I’ll still definitely see a drop in rankings).
My blog is ultimately a hobby that I’ve invested less than $50 into over 6 years. But if I had some more budget – I’d put together a plan to build my brand online…
First make sure you know your target audience & do one of those SWOT analysis. Then make specific goals to establish some brand KPIs.
Here are some ideas on what to do next:
Get a relevant, easy to remember domain name!
Learn from my mistake, a short catchy domain name is an easy-win if you are just starting out from scratch. A lot of the best and obvious domain name will be taken however, so you’ll have to do some research first. If you are just starting out, don’t name your business until you secure your domain name!
Display Ads
Depending on your niche, you can set tiny max CPC bids in some instances – and they’ll still get thousands of impressions for very little spend. Gmail ads work particularly well for (potential) low CPM (cost per 1000 impressions).
Rotate your display ads’ design & colours to stop people ignoring them due to ‘banner blindness’.
Blog & Outreach
Blog are great for reaching people who are researching a potential purchase.
For example, I landed on Perfect Keto’s blog a few times whilst researching Exogenous Ketones. Then ended up buying their branded product on Keto-pro.co.uk; because, for what ever reason, I trusted their brand.
Create great content, with statistics, images and video – and then outreach it – i.e. send it to relevant blogs and websites.
If you can afford it, use “PR-Level” outreach and contact national newspapers etc. This can be done via websites such as gorkana
If you content gets links too – then great – that’s good for Search Engine Optimisation (SEO). Doing some of your own exclusive research and generating tables of statistics are great for generating back-links naturally i.e. passively.
So consider doing some market research using Google surveys etc. These guys calculated RV/Campervan depreciation in value, just by looking at vehicles for sale online and get hundreds of back-links.
To turn blog’s into direct sales, you can also use relevant ‘CTA’ images below your blog.
For example, if you post a blog about the Walking Path’s of Snowdonia on your Snowdonia-based-bed-&-breakfast website; consider adding a relevant & clickable ‘book now’ and/or ‘get your free brochure’ button with eye-catching image at the bottom of the post. Many people now do this with newsletter sign up pop ups, which are a bit annoying but do work.
Content is great – but tools tend to do better than copy. For example, NerdWallet’s top page in terms of organic traffic – is their mortgage calculator.
Reviews
As well as brand awareness, you want some social-proofing of your brand. Start with a free account on Trustpilot and GoogleMyBusiness
Video & Social Media
The number 1 mistake people make on social media is to harp on about their brand all the time. Be entertaining, provide useful information and insightful comments. If you are over-promotional, people will not follow you. Build some authority by providing helpful insights that your target market will appreciate.
Videos & podcasts can be costly in terms of time. If you don’t want to set up your own podcast, guest-appearance on other people’s podcasts can generate valuable awareness and also back-links to your website (important for Search Engine Optimisation/Rankings).
Build an amazing product and/or service
This is your foundation and one of the reasons that Apple is so successful. An LSD-fueled Steve Jobs came up with some amazing ideas and concepts. The brand also turned itself into unique hybrid of tech & fashion thanks to their pioneering products.
The big, light-up apple on the back of Macbooks no doubt was a design aimed at building brand awareness too!
Please note – I realise this blog has a rubbish social media following. But that’s due to lack of time/money investment. I generally just use this blog as somewhere to record my thoughts & to remember how to do all things marketing related. E.g. here are my notes so I remember how to use Screaming Frog to scrape OG tags.