
| Dev | ChatGPT |
| Usually an arrogant prick with God complex | Is God, or will be |
| Makes you feel like a thick bastard | Very polite |
| Makes you feel like you’re an annoyance | Always happy to help |
| Hates SEO/PPC | Loves everyone – or acts like it anyway |
| Costs about £4k a month to employ | Pro version costs about £10 a month |
| Gets angry at follow up questions | You can ask unlimited follow up questions |
Category: marketing
Responsive Youtube IFrame Embed
Go to a YouTube video – on YouTube.com
- Click “Share” then “Embed” and grab the code
Default Embed Code:
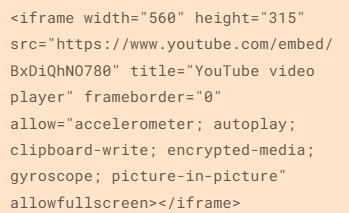
I changed the default width="560" at the start to width="100%"
Also added style="max-width: 600px;" - after allowfullscreen:

I can’t show an example unfortunately, as my Free WordPress.com blog doesn’t allow to add any code. The embed above isn’t fully responsive.
Content Marketing Fundamentals [Updated 2024]
Nobody gives a f*ck about your behind the scenes bollocks, and nobody is googling to find out about the industry award that you won (and paid about 10k to enter).
Create content that’s relevant and of interest to your target audience
Content marketing and inbound marketing is kind of, the new SEO. Google, as we’ve heard a million times, loves great content and great content attracts genuine links.
Create a blog and social media profiles that you’re customers will want to subscribe to – because they’re interesting!
The process is easy, the execution can be a bit of a b@stard to do though.
- Identify your target audience
- Find out where they hang out online e.g. which Reddit forums and Facebook groups etc
- Identify your target audience’s common questions and pain points
- Use a tool like SEMRush to ID low competition search terms regarding the questions & pain points
- Create useful, in-depth copy/posts that helps your target audience
- If resource available, create videos for YouTube based on posts that get most traction
- Create short videos suitable for social – with captions!
For blog content, see if you can match the topics you’ve found, with specific keywords, ideally with the highest volume.
Check the search engine results pages (SERPs) and identify any keywords which have “weak” or somewhat irrelevant results.
It’s a bit beyond the scope of this post, but look to optimise your blogs for “rich snippets”, by using lists and html tables.
To check for keywords, you’ll need Keyword Tool like SEMRush to do this, or search “free keyword tool”.
Keep each blog post specific to one or two keywords.
You can also promote your blog posts with outreach, although some content marketing gurus, say you’re better off investing all your time in creating content, rather than promoting it.
For Reddit, you can use this great Reddit Keyword Tool, to identify the most common topics of discussion, in a given forum/subReddit.
The backbone of good content, is that, well, it’s actually good – well written, easy to read, full of visual assets if possible.
When it comes to blog posts, make the content scannable with lists, bullet points and images. If you have the resource, infographics are always a good addition to a blog post.
Statistics are also a great way to attract links and citations from other websites. For example, if you work out the average price of a [given product or service] in the UK, it’s relatively likely to attract links. If you sell UK holiday homes or used campervans, you might work out the average price of new camper van, or the cost per holiday of an overseas holiday versus a holiday home.
Help, Help, Help, Sell
Gary V’s book Jab, Jab, Jab, Right Hook is a bit old now, but the adage of setting up a sale several times, before trying to promote your service or product is still valid, in my opinion.
The “jab” in the book title, is the useful or entertaining content aimed at your target audience
The “right hook” is a blog and/or social media post that aims to sell a product or service.

Consider:
- Would you follow a social account or blog that’s just trying to sell you a service or product?
- For example, if an accounting software company has a Facebook account that just promotrs its software directly in every single post, not many people will be interested. However, if the Facebook page posts about tax saving tips, digital marketing for small businesses etc it’s likely to get more engagement.
I’d also avoid lots of
- Behind the scenes posts.unless you’re an established brand, nobody gives a shit
- Virtue signalling posts
You might follow a brand or company on social media etc, that just promotes itself, if you already know the brand, or if you’re interested in working at the company.
However, unless you’re an established brand, or you create content just for recruitment purposes, then it’s generally best to create blog and social media posts that help, entertain, and/or interest your target audience.
Establish yourself as an authority in your niche, with helpful & insightful content
Drew Griffiths (2022)
It can definitely help to promote discounts and offers on social platforms and blogs, but that’s generally the that’s the “right hook”, whereas the “jab, jab, jab” relates to the helpful, insightful content that should take up about 75% of all your posts.
If you’re in the business to business sector for example, you can gain brand awareness and an online following by providing posts that provide helpful advise on SEO, PPC, Social Media Marketing, Digital Marketing Tools etc. If you’re just trying to directly sell your office chairs, or accounting software in every single blog and social media post, you’re probably not going to get a large, engaged, following.
Don’t Post Links all the Time on Social Media
Social media platforms, from Facebook to LinkedIn, all want to keep users, on their platform. Links will tend to take people onto different websites, and as a result, posting links to your blog etc, will tend to kill your organic reach (the amount of people who see your social media post).
Keto Diet Products Example
If you were running a business selling Keto supplements and foods. You can study the Keto subreddits and Facebook groups, and you’d probably find that there are lots of questions regarding keto desserts.
Jump onto SEMRush, or another SEO Tool and find search terms, and potential headings for blog posts – that have a low level of competition – i.e. it’s relatively easy to rank for.

Create in-depth keto dessert blog content that’s better than what already exists.
Optimise the content for the search terms that you’ve identified on SEMRush.
Reformat the content for social media. Captioned videos tend to do well, as these are the least popular form of content – social media is full of images and text posts, so it’s a bit easier to stand out with a video.
Consider creating a free eBook about keto desserts. Promote the eBook on social media to “warm up” your target audience to your brand* Remarket your products to those that download the eBook.
Create a serious of posts & videos regarding the best keto desserts, the best sweeteners and the best supplements to help with sugar cravings.
*It’s difficult to sell products, particularly high value products to people on Facebook, Instagram etc, as they’re not actively searching for something to buy. Best practice is said to be, create an offer e.g. an eBook, Webinar etc that’s directly of interest (and NOT necessarily directly about your product) and advertise it to your target market on social media – Then remarket to those that engage with your advert.
Hope this blog post helps!
I know the irony about in-depth, long format content that I’m touting in this post, but please bear in mind, I’m writing this on my lunch and I’m not trying to sell anything. Well, unless you want to buy an MMA T-shirt.
Examples of Great Content Marketing
The channel covers how to put together powerpoints, how to create videos for your small business and lots of marketing fundamentals for business owners
Daniel posts about tips on how to optimise your SEO, SEO mistakes to avoid and some very high level, useful SEO techniques and strategies to adopt.
Net World Sports
Net World Sports have a great range of highly visual buyers’ guides, size guides and a regularly updated blog.
Responsive Images with Inline CSS
This is how I create images that are full width in desktop devices and mobiles etc.
You just need to use:
max-width: 100%;
height: auto;
Good info here on W3 Schools
            <img src="image-address.png"
style="max-width: 100%; margin-bottom:0; max-width:1000px; height: auto;"
         alt="relevant description of image" >
Change the “max-width” to whatever you want the max width of the image to be on a desktop device.
For personal reference, this is the exact code I need for my own website with pre-built classes:
 <div style= "margin-bottom:20px;" >
      <div class="content-item">
            <img src="image-url" style="max-width: 100%; margin-bottom:0; max-width:1000px; height: auto;"
         alt="relevant description of image" >
      </div>
  </div>
Here’s another example that I used today (july 2023!)
<img src="drews-sexy-image.jpg" style="width:1000px; max-width: 100%; height: auto; padding-top:25px;" alt="Basketball hoop dimensions" />
In the code above^ – the image will be 1000px wide on desktop, and the width of the screen on smaller devices
Padding-top, just puts some white space above the image

By the way – when you set image sizes to % – this represents the % of the block that the image is contained within
Viewing Code From another website
Thanks to all the external sheets, this has become tricky.
I’ve been using this technique, because I’m an SEO Executive, developing pages for our Magento site, without any dev help – so I’m using existing pages and robbing bits of code to help me layout images properly.
This is for personal reference – so apologies if it doesn’t work for you (let me know)

Right click – Inspect Element
Click the pointer near the top left of the inspect element window – or hover in the code until the area you want to copy is highlighted.
In the elements window, find the element you want to rob the code for and hover over it with the pointer
Move upwards, until the entire section is highlighted – if you move upwards with the pointer and it selects the element/section above, then you’ve gone too far, so move down one
Right click – Copy – Copy Element
Paste into your own code
Note – unlike me (I’m updating the same site as I’m stealing code from) if you are trying to get the code form another website, you’ll need to get the style sheet.
Right click on the webpage and “View source” – then look for:
<link rel=”stylesheet” type=”text/css” href
and click the link after “href” – that should take you to the CSS sheet
Data Studio – Quick Tips (Advanced)
Speed Up Data Studio Reports (Significantly) – Extract Data
To speed up your reports – you can “Extract Data” and cache it.
It can help to have 2 copies of the report up – so you can see which metrics and dimensions you need to select when adding the data to extract and cache (also a good idea to test the extract data method on a copy of the report in case you faff anything up)
Go to “Add Data” in the top menu-bar
- Click on “Extract Data”
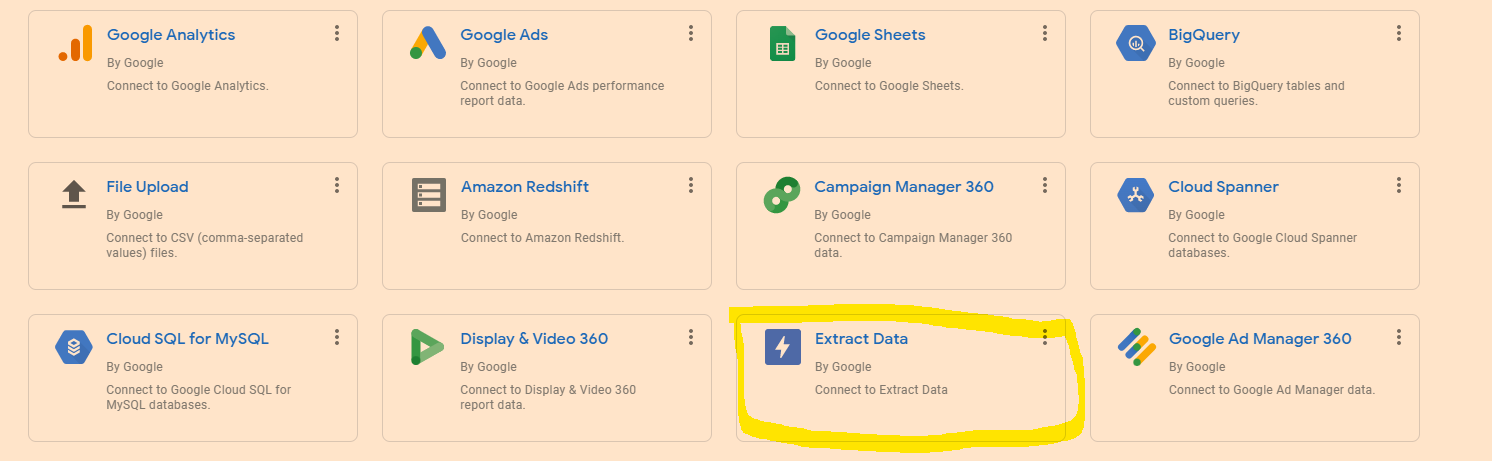
- Choose the data you need – eg Google Analytics
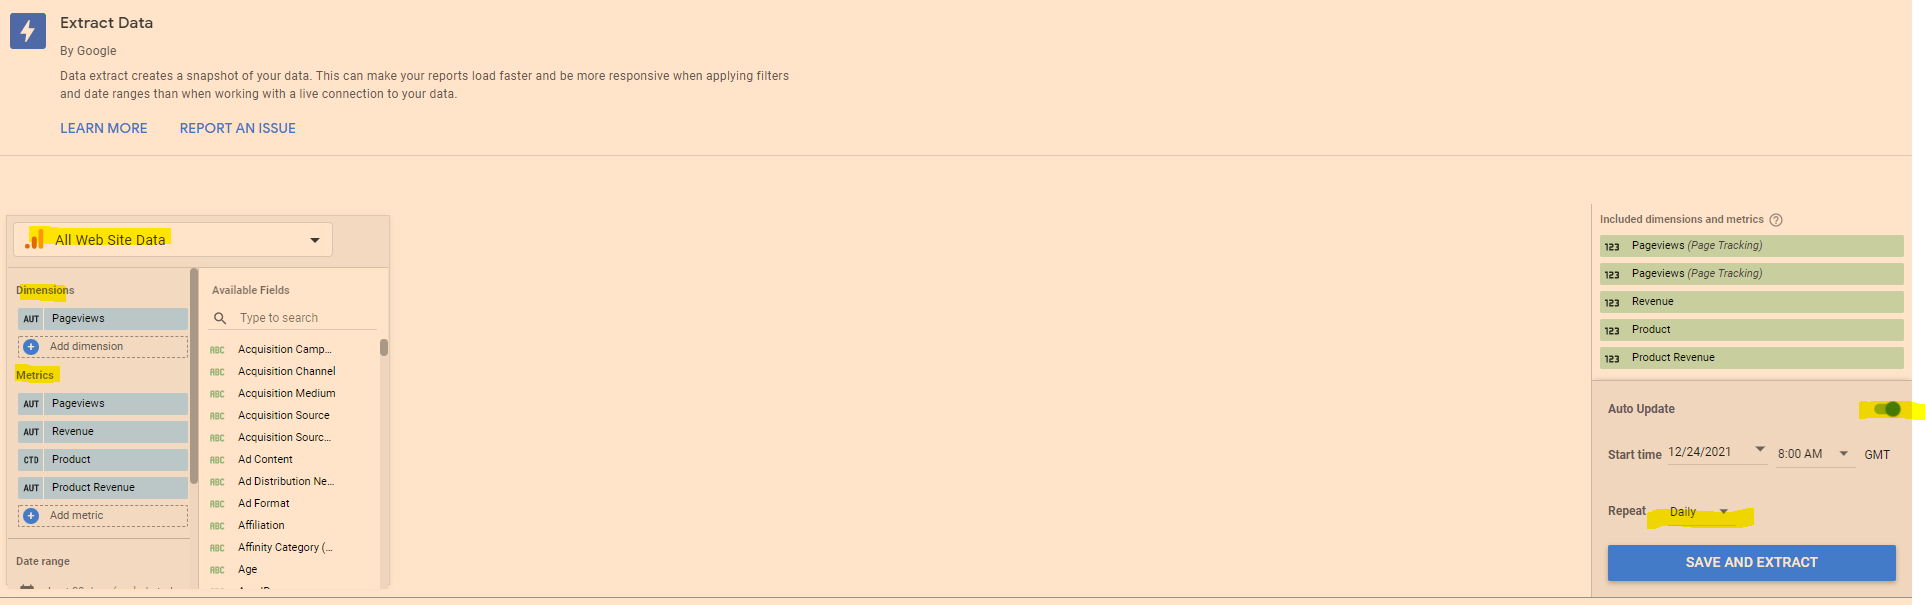
- Add the dimensions and metrics you need for the report
- On the Right hand side – click to turn “Auto Update” on
- Select “daily”
- Click “Save and Extract”
Sometimes you have to faff around a bit with the dimensions – Google Analytics doesn’t seem to like caching a dimension, but still goes super-quick if you cache the metrics only.
Edit in Bulk
If you want to edit all of the charts or tables on the page, in “Edit” mode, right click – go to “Select” and then choose “Tables on page” or whatever type of chart, scorecard or table you’ve selected.
This works instead of CTRL clicking or SHIFT clicking – but you can only change charts or visualisations of the same type at the same time. You can change the style, add a comparison date range etc.
Brand Colour Theme in Data Studio
Click on “Them and Layout” at the top of the screen and then, near the bottom right click “Extract Theme from Image” – you can then upload your logo and choose a theme with your brand colours.
If your shite at presentation like me, this is helpful.
Copy & Paste Styles
In Data Studio – If you want to copy a style from a chart or table, right click it, then choose “copy”
Click another chart/table and the right click – Paste Special – Paste Style Only
Add Chart Filters to an Entire Report
If you want to add a filter to all the data in a report, then it can be a pain going through the charts individually.
Right click on a blank part of the page –
- Click “Current Page Settings”
- On the right hand side – click “Create a Filter”
- Choose or create a filter to apply to all the page
To add a filter to multiple pages
- Right click on a blank part of the page
- click “Report Settings”
- click “Add a filter” in the right side-menu
Add Elements to All Pages of a Report in Data Studio
If you want to add a header and date range selector, for example, to all the pages in the report – add the elements to a page, then right click on the element – and choose “Make report-level”
Quickly Align Elements in Data Studio
Click and drag to select all the elements
Right click – choose “align” – “middle” to get everything inline horizontally
To get an equal space between all the elements, so they’re spaced evenly:
– click and drag to select the elements
– right click – select “Distribute”
– “horizontally” to space evenly across the page, or “vertically” to distribute evenly in a vertical manner.
You can also tidy up individual tables to align the columns vertically – right click and select “”Fit to data”
See our Data Studio Fields & Filters blog post – https://businessdaduk.com/2021/12/15/data-studio-fields-filters-notes/
Data Studio – Data Blending
Bit of a ball ache to work out
There are a few ways to blend data, here’s my fave:
- Go to “Resources” in the main menu at the top
- Click “manage blended data” option
- Click “Add a Data View”
- Choose a Data Source e.g. Search Console
- Then “Add a Table” and include another data Source for blending – e.g. GA
or click “blend data” on an existing table or chart – and select another data source - Choose a common “key” to both data sources e.g. “Date”
- Choose the metrics you want from each Data Source – I wanted to get daily revenue into my search console reports:

Using the blended data above, I can now add Revenue from Google Analytics to my search console reports. I have to remember however, that the revenue is simply attributed to each day and not any queries
**Update to the screenshot –
add a table filter to get organic only revenue from GA.
To be able to filter Revenue to organic only – you need to add a “Dimension” to the table on the right – click the “+” next to “Add dimension” in the GA data and then “Default Channel Grouping” – you can then create a filter in the report:

Blending Search Console Data in Data Studio
Another common reason to blend data – is to get average position data from Search Console “Site Impression reports, added to “URL Impression” data:
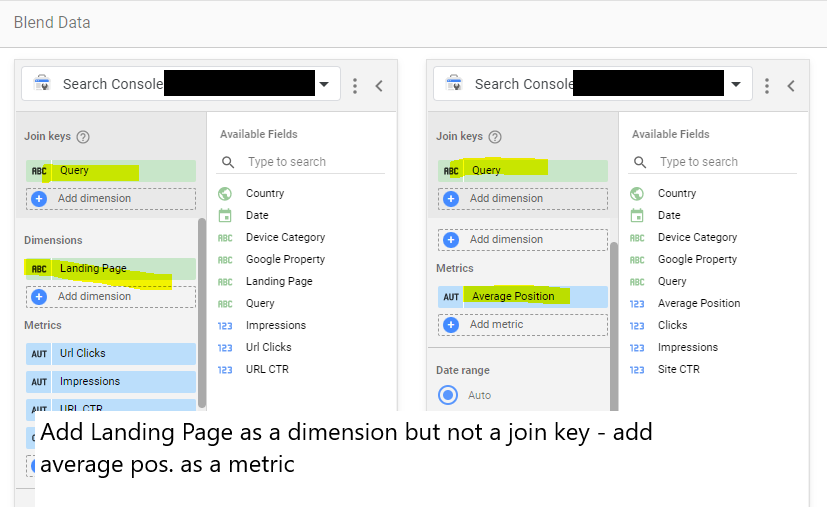
URL impression vs site impression
Incidentally –
the main difference between Data Studio Search Console URL Impression Vs Site Impression data – is that Site Impression contains the Average Position metric and URL Impression contains the Landing Page metric. So when you’re blending the data from both sources, make sure you have “Landing Page” as a metric and “Average Position”.
Data Studio Fields & Filters – Notes
Once you’ve created a field – add it to your chart as a Dimension
Mixed Case URLs
Having a mix of URL cases in the letters can faff with your data as D.S. might think each capitalisation variation is a new URL:

- Click on the Data Tab to the right – then “Create new field” or “Add a Field”
- Name the field “Lower Source” type in “LOWER(“
- Then add “Source” from “Available Fields” to the left
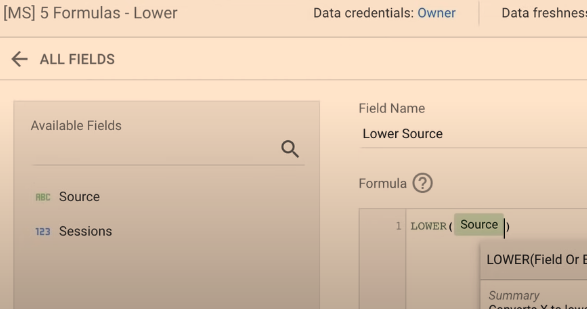
- Click “Save” and add “Lower Source” to the table as a Dimension
Concatenate Data

- Create or “Add a Field”
- In the Formula box type “CONCAT” and then select the fields you want to use
- Close the formula with the final “)” and save it
Internal Site Searches – Extract Search Query
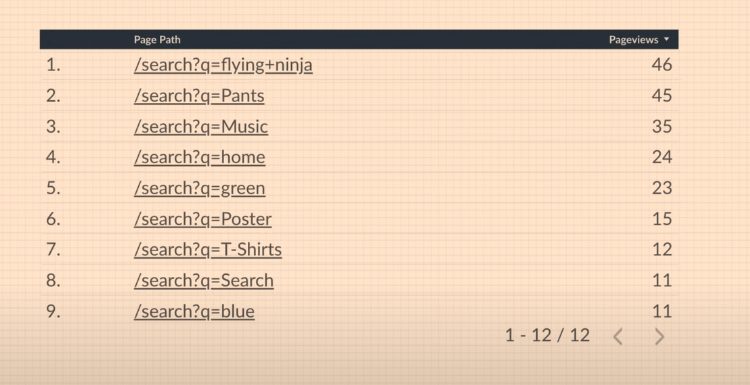
Make the data look nicer and get the search term on its own in the table.
- Select to a “Add a Field”
- Use REGEXP_EXTRACT formula to pull out the search terms and get rid of “/search?q”
- Use the REGEX shown below:

Search Queries – Pull Out Questions – What, Why, When?
- Create / Add a New Field
- Add REGEX as shown below and save

- Add New Field as a Dimension to the table
- Create a table/data Filter so that you include only table rows that equate to “True” in the new dimension/column
CASE Formulas in Data Studio
CASE formulas are basically “If this, then do that” formulas
When X happens, Then do Y
You can use the CASE Formula to classify and group channels together
For example:
WHEN query matches “who”, then display text “Who?” in the table

- In the Formula – you need a “catch all” default for when nothing is true in the criteria
- If the search doesn’t contain “who, what, why” etc. then:
ELSE “others”
So if the search term, doesn’t match any of the REGEX criteria – classify it as “others”

- Add the new field – to the table or report

Date Ranges & Filter Controls
Taken me ages to work this out – I’ve only just twigged:
You can add Comparisons, Search Boxes, Drop Down Menus and all sorts to your Data Studio Reports
For controls and filters to work – you need the chart or table to have “Default Date Range” set to “Auto”
See my post about REGEX for SEO here.
Ta
If you want a pre-made Data Studio template, you can send me some money and hope for the best.
How to Get More Followers on Linkedin (2021)
I’ve made some notes from a few videos on YouTube – thought I may as well turn it into a blog post…
Summary – Get More Linkedin Followers to Your Business Page
- Pay for ads to get up to 1,000 followers to begin with
- Get employees to like and share
- Get employees to create own content & tag company page*
- Don’t post too many links (links kill reach)
- Don’t post about the company all the time – where’s the value?
- Do post useful content that helps target audience – provide value
- Engage in relevant groups
- Post videos with transcripts – upload direct to Linkedin
- Reuse videos that are under 1 minute long for YouTube Shorts
- Super-admin – can invite up to 100 members per month
- Tag customers and other businesses in your post
- Share and comment on trending topics/news
- The higher up in the business an employee is, the more engagement it will tend to get if they share company posts**
*Employees could create videos, shares quotes etc. doesn’t have to be perfect and professional, as it’s the user’s content not the company’s
**People use Linkedin for networking/brown-nosing, so the more influential a person is, the more engagement they will tend to get
Notes from videos:
- Linkedin has the Most potential for organic reach at the moment
- Use Linkedin Polls for engagement
- Engage and post in relevant Linkedin groups
- Don’t overdo self promotion
- Find out what target audience are interested in – post about that
- Don’t post about your company all of the time
- Post 4 to 5 times per week
- Post 25% about your service or product – 75% relevant, useful, informative content
- Run ads and add the “follow button”
- Get employees to engage with content – make sure they optimize their profiles and networks too
- Get employees to share the posts on their personal profiles
- Invite connections to like the business page (you have to be a page admin)
- Define perfect follower/customer persona
- Determine the needs of the perfect follower – personal and business life
- What is their company/employer’s needs?
- Become an authority in the niche by posting informative content that addresses their needs
- Get your employees to engage and share posts
- Get employees to share but with their own commentary
- Get employees to reply to comments on your posts
- Don’t just promote the company
- Get employees to share their own unique content that is of value and 20% of the time promote your business – and tag company page
- Create an industry specific Linkedin group and invite people – link group to company page so you can post as company
- In the group create 90% value posts and 10% promotional posts
- Linkedin Ads – target specific people, area, industry, job title etc. – use ads to get 1,000 followers to help organic reach afterwards
Notes from Reading Articles about Getting More Linkedin Followers
– social media platforms, want to be content platforms:
- More videos (with in-video transcripts),
- Business related Memes/quotes (scannable content, nobody really reads posts on FB or Linkedin)
- Publish more posts without links (platforms tend to kill your reach if you link out to other sites, apparently),
– Whilst content that is posted directly to a social media platform will tend to be amplified, if it is hosted externally
e.g. on Youtube, the reach will be killed by the platform – they don’t want people to leave their site/app via links.
- create “micro-content” for social media, by turning videos, webinars etc into smaller content
e.g. quotes from videos into images and memes, longer videos into 30 second clips with in-video transcripts.
- Youtube shorts are meant to be a big opportunity at the moment – content less than 1 minute long, filmed vertically on a phone. These could also be potentially used on social https://blog.youtube/news-and-events/building-youtube-shorts/
- Targeting specific locations? Use search function on Linkedin and Instagram to comment on relevant posts.
- Incentivise employee engagement – top 3 people with most likes and shares each month get £100 voucher or some company stash – emphasise it is completely voluntary
- Use Twitter advanced search to find relevant questions and topics to engage with.
- Twitter – find relevant influencers – engaged with (and potentially follow) people who engage with the influencer’s tweets. These people will tend to be relevant and active on Twitter
Google Ads Reporting Script
This script is no longer live, but I had it in my account, I’m pasting it here for safekeeping and future reference as it is pretty handy:
to use the script:
- Make a copy of this spreadsheet https://docs.google.com/spreadsheets/d/1mNjc7iJWOIq580DMLf6rYKT8xRAcl2MynnGSY29UiXY/edit#gid=3
- Put the URL of the sheet in the code below – next to where it says – var SPREADSHEET_URL =
- Change the email address from drewgriffiths@live.com to your email – on the line that starts with – var RECIPIENT_EMAIL =

- Sign into Google Ads
- Click on “Tools & Settings” on the top menu near the right hand side
- Click “scripts”
- Click the addition (+) sign to add a new script
- Paste in the below script – save – preview and then run
// Copyright 2015, Google Inc. All Rights Reserved.
//
// Licensed under the Apache License, Version 2.0 (the "License");
// you may not use this file except in compliance with the License.
// You may obtain a copy of the License at
//
//     http://www.apache.org/licenses/LICENSE-2.0
//
// Unless required by applicable law or agreed to in writing, software
// distributed under the License is distributed on an "AS IS" BASIS,
// WITHOUT WARRANTIES OR CONDITIONS OF ANY KIND, either express or implied.
// See the License for the specific language governing permissions and
// limitations under the License.

/**
 * @name Account Summary Report
 *
 * @overview The Account Summary Report script generates an at-a-glance report
 *     showing the performance of an entire Google Ads account. See
 *     https://developers.google.com/google-ads/scripts/docs/solutions/account-summary
 *     for more details.
 *
 * @author Google Ads Scripts Team [adwords-scripts@googlegroups.com]
 *
 * @version 1.1
 *
 * @changelog
 * - version 1.1
 *   - Add user-updateable fields, and ensure report row ordering.
 * - version 1.0.4
 *   - Improved code readability and comments.
 * - version 1.0.3
 *   - Added validation for external spreadsheet setup.
 * - version 1.0.2
 *   - Fixes date formatting bug in certain timezones.
 * - version 1.0.1
 *   - Improvements to time zone handling.
 * - version 1.0
 *   - Released initial version.
 */

var RECIPIENT_EMAIL = 'drewgriffiths@live.com';

var SPREADSHEET_URL = 'https://docs.google.com/spreadsheets/d/1mNjc7iJWOIq580DMLf6rYKT8xRAcl2MynnGSY29UiXY/edit#gid=3';

/**
 * Configuration to be used for running reports.
 */
var REPORTING_OPTIONS = {
  // Comment out the following line to default to the latest reporting version.
  apiVersion: 'v201809'
};

/**
 * To add additional fields to the report, follow the instructions at the link
 * in the header above, and add fields to this variable, taken from the Account
 * Performance Report reference:
 * https://developers.google.com/adwords/api/docs/appendix/reports/account-performance-report
 */
var REPORT_FIELDS = [
  {columnName: 'Cost', displayName: 'Cost'},
  {columnName: 'AverageCpc', displayName: 'Avg. CPC'},
  {columnName: 'Ctr', displayName: 'CTR'},
  {columnName: 'Impressions', displayName: 'Impressions'},
  {columnName: 'Clicks', displayName: 'Clicks'}
];

function main() {
  Logger.log('Using spreadsheet - %s.', SPREADSHEET_URL);
  var spreadsheet = validateAndGetSpreadsheet();
  spreadsheet.setSpreadsheetTimeZone(AdsApp.currentAccount().getTimeZone());
  spreadsheet.getRangeByName('account_id_report').setValue(
      AdsApp.currentAccount().getCustomerId());

  var yesterday = getYesterday();
  var date = getFirstDayToCheck(spreadsheet, yesterday);

  var rows = [];
  var existingDates = getExistingDates();

  while (date.getTime() <= yesterday.getTime()) {
    if (!existingDates[date]) {
      var row = getReportRowForDate(date);
      rows.push([new Date(date)].concat(REPORT_FIELDS.map(function(field) {
        return row[field.columnName];
      })));
      spreadsheet.getRangeByName('last_check').setValue(date);
    }
    date.setDate(date.getDate() + 1);
  }

  if (rows.length > 0) {
    writeToSpreadsheet(rows);

    var email = spreadsheet.getRangeByName('email').getValue();
    if (email) {
      sendEmail(email);
    }
  }
}

/**
 * Retrieves a lookup of dates for which rows already exist in the spreadsheet.
 *
 * @return {!Object} A lookup of existing dates.
 */
function getExistingDates() {
  var spreadsheet = validateAndGetSpreadsheet();
  var sheet = spreadsheet.getSheetByName('Report');

  var data = sheet.getDataRange().getValues();
  var existingDates = {};
  data.slice(5).forEach(function(row) {
    existingDates[row[1]] = true;
  });
  return existingDates;
}

/**
 * Sorts the data in the spreadsheet into ascending date order.
 */
function sortReportRows() {
  var spreadsheet = validateAndGetSpreadsheet();
  var sheet = spreadsheet.getSheetByName('Report');

  var data = sheet.getDataRange().getValues();
  var reportRows = data.slice(5);
  if (reportRows.length) {
    reportRows.sort(function(rowA, rowB) {
      if (!rowA || !rowA.length) {
        return -1;
      } else if (!rowB || !rowB.length) {
        return 1;
      } else if (rowA[1] < rowB[1]) {
        return -1;
      } else if (rowA[1] > rowB[1]) {
        return 1;
      }
      return 0;
    });
    sheet.getRange(6, 1, reportRows.length, reportRows[0].length)
        .setValues(reportRows);
  }
}

/**
 * Append the data rows to the spreadsheet.
 *
 * @param {Array<Array<string>>} rows The data rows.
 */
function writeToSpreadsheet(rows) {
  var access = new SpreadsheetAccess(SPREADSHEET_URL, 'Report');
  var emptyRow = access.findEmptyRow(6, 2);
  if (emptyRow < 0) {
    access.addRows(rows.length);
    emptyRow = access.findEmptyRow(6, 2);
  }
  access.writeRows(rows, emptyRow, 2);
  sortReportRows();
}

function sendEmail(email) {
  var day = getYesterday();
  var yesterdayRow = getReportRowForDate(day);
  day.setDate(day.getDate() - 1);
  var twoDaysAgoRow = getReportRowForDate(day);
  day.setDate(day.getDate() - 5);
  var weekAgoRow = getReportRowForDate(day);

  var html = [];
  html.push(
    '<html>',
      '<body>',
        '<table width=800 cellpadding=0 border=0 cellspacing=0>',
          '<tr>',
            '<td colspan=2 align=right>',
              "<div style='font: italic normal 10pt Times New Roman, serif; " +
                  "margin: 0; color: #666; padding-right: 5px;'>" +
                  'Powered by Google Ads Scripts</div>',
            '</td>',
          '</tr>',
          "<tr bgcolor='#3c78d8'>",
            '<td width=500>',
              "<div style='font: normal 18pt verdana, sans-serif; " +
              "padding: 3px 10px; color: white'>Account Summary report</div>",
            '</td>',
            '<td align=right>',
              "<div style='font: normal 18pt verdana, sans-serif; " +
              "padding: 3px 10px; color: white'>",
               AdsApp.currentAccount().getCustomerId(), '</h1>',
            '</td>',
            '</tr>',
          '</table>',
          '<table width=800 cellpadding=0 border=0 cellspacing=0>',
            "<tr bgcolor='#ddd'>",
              '<td></td>',
              "<td style='font: 12pt verdana, sans-serif; " +
                  'padding: 5px 0px 5px 5px; background-color: #ddd; ' +
                  "text-align: left'>Yesterday</td>",
              "<td style='font: 12pt verdana, sans-serif; " +
                  'padding: 5px 0px 5px 5px; background-color: #ddd; ' +
                  "text-align: left'>Two Days Ago</td>",
              "<td style='font: 12pt verdana, sans-serif; " +
                  'padding: 5px 0px 5x 5px; background-color: #ddd; ' +
                  "text-align: left'>A week ago</td>",
            '</tr>');
  REPORT_FIELDS.forEach(function(field) {
    html.push(emailRow(
        field.displayName, field.columnName, yesterdayRow, twoDaysAgoRow,
        weekAgoRow));
  });
  html.push('</table>', '</body>', '</html>');
  MailApp.sendEmail(email, 'Google Ads Account ' +
      AdsApp.currentAccount().getCustomerId() + ' Summary Report', '',
      {htmlBody: html.join('\n')});
}

function emailRow(title, column, yesterdayRow, twoDaysAgoRow, weekAgoRow) {
  var html = [];
  html.push('<tr>',
      "<td style='padding: 5px 10px'>" + title + '</td>',
      "<td style='padding: 0px 10px'>" + yesterdayRow[column] + '</td>',
      "<td style='padding: 0px 10px'>" + twoDaysAgoRow[column] +
          formatChangeString(yesterdayRow[column], twoDaysAgoRow[column]) +
          '</td>',
      "<td style='padding: 0px 10px'>" + weekAgoRow[column] +
          formatChangeString(yesterdayRow[column], weekAgoRow[column]) +
          '</td>',
      '</tr>');
  return html.join('\n');
}


function getReportRowForDate(date) {
  var timeZone = AdsApp.currentAccount().getTimeZone();
  var dateString = Utilities.formatDate(date, timeZone, 'yyyyMMdd');
  return getReportRowForDuring(dateString + ',' + dateString);
}

function getReportRowForDuring(during) {
  var report = AdsApp.report(
      'SELECT ' +
          REPORT_FIELDS
              .map(function(field) {
                return field.columnName;
              })
              .join(',') +
          ' FROM ACCOUNT_PERFORMANCE_REPORT ' +
          'DURING ' + during,
      REPORTING_OPTIONS);
  return report.rows().next();
}

function formatChangeString(newValue,  oldValue) {
  var x = newValue.indexOf('%');
  if (x != -1) {
    newValue = newValue.substring(0, x);
    var y = oldValue.indexOf('%');
    oldValue = oldValue.substring(0, y);
  }

  var change = parseFloat(newValue - oldValue).toFixed(2);
  var changeString = change;
  if (x != -1) {
    changeString = change + '%';
  }

  if (change >= 0) {
    return "<span style='color: #38761d; font-size: 8pt'> (+" +
        changeString + ')</span>';
  } else {
    return "<span style='color: #cc0000; font-size: 8pt'> (" +
        changeString + ')</span>';
  }
}

function SpreadsheetAccess(spreadsheetUrl, sheetName) {
  this.spreadsheet = SpreadsheetApp.openByUrl(spreadsheetUrl);
  this.sheet = this.spreadsheet.getSheetByName(sheetName);

  // what column should we be looking at to check whether the row is empty?
  this.findEmptyRow = function(minRow, column) {
    var values = this.sheet.getRange(minRow, column,
        this.sheet.getMaxRows(), 1).getValues();
    for (var i = 0; i < values.length; i++) {
      if (!values[i][0]) {
        return i + minRow;
      }
    }
    return -1;
  };
  this.addRows = function(howMany) {
    this.sheet.insertRowsAfter(this.sheet.getMaxRows(), howMany);
  };
  this.writeRows = function(rows, startRow, startColumn) {
    this.sheet.getRange(startRow, startColumn, rows.length, rows[0].length).
        setValues(rows);
  };
}

/**
 * Gets a date object that is 00:00 yesterday.
 *
 * @return {Date} A date object that is equivalent to 00:00 yesterday in the
 *     account's time zone.
 */
function getYesterday() {
  var yesterday = new Date(new Date().getTime() - 24 * 3600 * 1000);
  return new Date(getDateStringInTimeZone('MMM dd, yyyy 00:00:00 Z',
      yesterday));
}

/**
 * Returned the last checked date + 1 day, or yesterday if there isn't
 * a specified last checked date.
 *
 * @param {Spreadsheet} spreadsheet The export spreadsheet.
 * @param {Date} yesterday The yesterday date.
 *
 * @return {Date} The date corresponding to the first day to check.
 */
function getFirstDayToCheck(spreadsheet, yesterday) {
  var last_check = spreadsheet.getRangeByName('last_check').getValue();
  var date;
  if (last_check.length == 0) {
    date = new Date(yesterday);
  } else {
    date = new Date(last_check);
    date.setDate(date.getDate() + 1);
  }
  return date;
}

/**
 * Produces a formatted string representing a given date in a given time zone.
 *
 * @param {string} format A format specifier for the string to be produced.
 * @param {date} date A date object. Defaults to the current date.
 * @param {string} timeZone A time zone. Defaults to the account's time zone.
 * @return {string} A formatted string of the given date in the given time zone.
 */
function getDateStringInTimeZone(format, date, timeZone) {
  date = date || new Date();
  timeZone = timeZone || AdsApp.currentAccount().getTimeZone();
  return Utilities.formatDate(date, timeZone, format);
}

/**
 * Validates the provided spreadsheet URL to make sure that it's set up
 * properly. Throws a descriptive error message if validation fails.
 *
 * @return {Spreadsheet} The spreadsheet object itself, fetched from the URL.
 */
function validateAndGetSpreadsheet() {
  if ('YOUR_SPREADSHEET_URL' == SPREADSHEET_URL) {
    throw new Error('Please specify a valid Spreadsheet URL. You can find' +
        ' a link to a template in the associated guide for this script.');
  }
  var spreadsheet = SpreadsheetApp.openByUrl(SPREADSHEET_URL);
  var email = spreadsheet.getRangeByName('email').getValue();
  if ('foo@example.com' == email) {
    throw new Error('Please either set a custom email address in the' +
        ' spreadsheet, or set the email field in the spreadsheet to blank' +
        ' to send no email.');
  }
  return spreadsheet;
}
Bob’s your uncle
The code was originally on the Google Developer’s site here – https://developers.google.com/adwords/scripts/docs/solutions/ad-performance
Please Google, don’t bankrupt me for using the script on here! I’ll take it down if it upsets thee.
