Why Every SEO Should Learn Curl (And How to Start in 5 Minutes)
Most SEOs rely on Screaming Frog, Sitebulb, or Chrome DevTools to check how a website is performing technically. All brilliant tools, but there’s something faster, free, and already installed on your computer: a tiny program called curl.
First, what’s a “terminal”?
Before computers had pretty desktops and clickable icons, you controlled them by typing instructions. That text-based interface is called a terminal, or on Windows, Command Prompt. Think of it as texting your computer directly: you type a command, it does the thing, and prints text back at you.
It’s still around today because for certain technical jobs, typing one line is faster than clicking through ten menus.
What is curl?
curl stands for “Client URL.” It’s a built-in tool on Windows, Mac, and Linux that fetches webpages without rendering them. Instead of seeing the pretty version your browser shows you, you see the raw response the server sends back. Exactly what Googlebot sees when it crawls your site.
That’s the gold for SEO. Your browser hides things; curl shows everything.
Your first curl check in 4 steps
Open Command Prompt. Press the Windows key, type cmd, hit Enter.
Type the command:curl -I https://yourdomain.com (the capital I means “headers only”).
Hit Enter. The server’s response headers print out instantly.
Read the results. Status code is on line one — 200 means OK, 301 means redirect, 404 means missing.
That’s it. You’ve just made the same request Google makes to your site thousands of times a day.
Why this matters for SEO
A single curl check reveals things a browser hides: status codes (is the page actually returning 200?), caching rules (is the CDN configured properly?), security headers (HSTS, X-Frame-Options), server fingerprints (what platform is the site built on?), and redirect chains (are there unnecessary hops slowing down crawling?).
It’s also the fastest way to spot staging environments accidentally leaking into Google’s index, broken canonicals, or compression that’s silently switched off.
That saves the complete response, headers and HTML- to a text file you can open in VS Code or Notepad++. Brilliant for auditing canonicals, hreflang, structured data, and meta tags in seconds.
The takeaway
Curl is the closest thing you’ll get to seeing your site through Google’s eyes. Five minutes to learn, a lifetime of faster audits. Open Command Prompt today and try it on your homepage, you’ll be amazed what it tells you.
It’s a way of pulling info from websites, without a browser. I think
Having a high-quality, high-traffic blog in the same niche can significantly enhance the organic rankings of an eCommerce site for commercial terms like “buy football goals.” Here’s how:
Increased Topical Authority
Search engines such as Google prioritise specific knowledge and expertise. A blog that focuses on football-related topics showcases expertise and builds authority within the niche. This can enhance the credibility of the eCommerce site as a reliable source for football equipment.
If you have 30 excellent, well written, detailed posts about football, then for an array of reasons from topical authority to social shares and backlinks, the eCommerce ‘section’ of your site will tend to rank a lot higher for commercial terms.
Top tip – include your own research and data. People love to link back to statistics. A good example with the NOW Foods 3rd party lab testing of creatine gummies – showing half of them had hardly any creatine in them.
Internal Linking Opportunities
A well-organized blog provides the chance to link to your product pages (e.g., “buy football goals”) using keyword-rich anchor text. This not only drives traffic to those pages but also indicates to search engines the relevance of your product pages for specific keywords.
Improved Backlink Profile
Blogs tend to attract more backlinks than product pages because they offer valuable, non-commercial content. These backlinks to your blog can transfer authority to your eCommerce site if you effectively link the blog to your product pages.
Keyword Coverage
Blogs enable you to target informational keywords like “how to set up a football goal” or “best football training drills,” which may not fit well on product pages. Once users visit these blog pages, you can direct them toward related products, creating a smooth transition from information to purchase.
Increased Dwell Time
High-quality content keeps users engaged on your site for longer periods. This increased dwell time signals to search engines that your site offers valuable content, which can positively influence rankings across the board, including for commercial terms.
Capture Users at Different Stages of the Sales Funnel
Blogs can attract users who are in the awareness or consideration stages of their buying journey. For instance:
A post titled “5 Things to Consider When Buying Football Goals” can inform users while subtly promoting your products.
If they choose to buy, they’re already on your site and more likely to make a purchase.
Use exit intent pop-ups to build an email list – incentivise sign ups with discounts
Have a sticky banner with a special offer
Make the brand stand out in images and banners
Brand Awareness!
Anybody can set up a website and sell stuff, and create some ads – but you won’t get direct visitors and people searching for your brand (a HUGE SEO ranking factor) if you haven’t built your brand.
Brand bias is also huge on products – take trainers, football boots and clothes for example. A top quality blog with good content can help build your brand awareness massively.
Establishes Authority & Expertise
Marketing bellends call this “thought leadership” and other contrived BS terms to make it sound impressive. But, at the end of the day, if you read a local PT’s blog about fitness and nutrition and it’s amazing, and references meta-analysis and robust research; you’ll probably be inclined to contact him or her if you are looking for a PT in the future? Especially if they display other EAT – Expertise, Authority and Trustworthiness, like a PhD in Exercise Physiology and 20 years experience as a Navy Seal fitness instructor and 10 years as a Premier League Physiotherapy – just to give you a realistic example.
Gives You an Idea of What Your Audience Wants More of
Use search console to see what your blog posts rank for. Take note of any quasi-relevant search terms.
For example, my MMA diet plan, was ranking for Boxing Diet Plan – so I created a new page for this second search term.
In addition to expanding your offerings in terms of content and products, see which are your most popular posts, and if these posts can inspire more content or products. Especially true if the posts related to pain-points of your target audience.
Nobody gives a f*ck about your behind the scenes bollocks, and nobody is googling to find out about the industry award that you won (and paid about 10k to enter).
Create content that’s relevant and of interest to your target audience
Content marketing and inbound marketing is kind of, the new SEO. Google, as we’ve heard a million times, loves great content and great content attracts genuine links.
Create a blog and social media profiles that you’re customers will want to subscribe to – because they’re interesting!
The process is easy, the execution can be a bit of a b@stard to do though.
Identify your target audience
Find out where they hang out online e.g. which Reddit forums and Facebook groups etc
Identify your target audience’s common questions and pain points
Use a tool like SEMRush to ID low competition search terms regarding the questions & pain points
Create useful, in-depth copy/posts that helps your target audience
If resource available, create videos for YouTube based on posts that get most traction
Create short videos suitable for social – with captions!
For blog content, see if you can match the topics you’ve found, with specific keywords, ideally with the highest volume.
Check the search engine results pages (SERPs) and identify any keywords which have “weak” or somewhat irrelevant results.
It’s a bit beyond the scope of this post, but look to optimise your blogs for “rich snippets”, by using lists and html tables.
To check for keywords, you’ll need Keyword Tool like SEMRush to do this, or search “free keyword tool”.
Keep each blog post specific to one or two keywords.
You can also promote your blog posts with outreach, although some content marketing gurus, say you’re better off investing all your time in creating content, rather than promoting it.
For Reddit, you can use this great Reddit Keyword Tool, to identify the most common topics of discussion, in a given forum/subReddit.
The backbone of good content, is that, well, it’s actually good – well written, easy to read, full of visual assets if possible.
When it comes to blog posts, make the content scannable with lists, bullet points and images. If you have the resource, infographics are always a good addition to a blog post.
Statistics are also a great way to attract links and citations from other websites. For example, if you work out the average price of a [given product or service] in the UK, it’s relatively likely to attract links. If you sell UK holiday homes or used campervans, you might work out the average price of new camper van, or the cost per holiday of an overseas holiday versus a holiday home.
Help, Help, Help, Sell
Gary V’s book Jab, Jab, Jab, Right Hook is a bit old now, but the adage of setting up a sale several times, before trying to promote your service or product is still valid, in my opinion.
The “jab” in the book title, is the useful or entertaining content aimed at your target audience
The “right hook” is a blog and/or social media post that aims to sell a product or service.
Would you follow a social account or blog that’s just trying to sell you a service or product?
For example, if an accounting software company has a Facebook account that just promotrs its software directly in every single post, not many people will be interested. However, if the Facebook page posts about tax saving tips, digital marketing for small businesses etc it’s likely to get more engagement.
I’d also avoid lots of
Behind the scenes posts.unless you’re an established brand, nobody gives a shit
Virtue signalling posts
You might follow a brand or company on social media etc, that just promotes itself, if you already know the brand, or if you’re interested in working at the company.
However, unless you’re an established brand, or you create content just for recruitment purposes, then it’s generally best to create blog and social media posts that help, entertain, and/or interest your target audience.
Establish yourself as an authority in your niche, with helpful & insightful content
Drew Griffiths (2022)
It can definitely help to promote discounts and offers on social platforms and blogs, but that’s generally the that’s the “right hook”, whereas the “jab, jab, jab” relates to the helpful, insightful content that should take up about 75% of all your posts.
If you’re in the business to business sector for example, you can gain brand awareness and an online following by providing posts that provide helpful advise on SEO, PPC, Social Media Marketing, Digital Marketing Tools etc. If you’re just trying to directly sell your office chairs, or accounting software in every single blog and social media post, you’re probably not going to get a large, engaged, following.
Don’t Post Links all the Time on Social Media
Social media platforms, from Facebook to LinkedIn, all want to keep users, on their platform. Links will tend to take people onto different websites, and as a result, posting links to your blog etc, will tend to kill your organic reach (the amount of people who see your social media post).
Keto Diet Products Example
If you were running a business selling Keto supplements and foods. You can study the Keto subreddits and Facebook groups, and you’d probably find that there are lots of questions regarding keto desserts.
Jump onto SEMRush, or another SEO Tool and find search terms, and potential headings for blog posts – that have a low level of competition – i.e. it’s relatively easy to rank for.
Create in-depth keto dessert blog content that’s better than what already exists.
Optimise the content for the search terms that you’ve identified on SEMRush.
Reformat the content for social media. Captioned videos tend to do well, as these are the least popular form of content – social media is full of images and text posts, so it’s a bit easier to stand out with a video.
Consider creating a free eBook about keto desserts. Promote the eBook on social media to “warm up” your target audience to your brand* Remarket your products to those that download the eBook.
Create a serious of posts & videos regarding the best keto desserts, the best sweeteners and the best supplements to help with sugar cravings.
*It’s difficult to sell products, particularly high value products to people on Facebook, Instagram etc, as they’re not actively searching for something to buy. Best practice is said to be, create an offer e.g. an eBook, Webinar etc that’s directly of interest (and NOT necessarily directly about your product) and advertise it to your target market on social media – Then remarket to those that engage with your advert.
Hope this blog post helps!
I know the irony about in-depth, long format content that I’m touting in this post, but please bear in mind, I’m writing this on my lunch and I’m not trying to sell anything. Well, unless you want to buy an MMA T-shirt.
The channel covers how to put together powerpoints, how to create videos for your small business and lots of marketing fundamentals for business owners
Semantic search adds context and meaning to search results. For example, if someone is searching for “Lego” – do they want to buy Lego toys, or see a Lego movie or TV show (Ninjago is great). Another example might be “Tesla” – do people want to see the latest self-driving car, or learn more about Tesla the scientist and inventor?
How to Optimise for Semantic Search
Make sure you understand search intent and any confusing searches like Tesla(inventor or car?), Jaguar (car or animal?), etc
Look for structured data opportunities
Optimise internal links – especially if you are using a “Pillar Post” and “Cluster Page” structure
Follow traditional on page SEO best practices with headers, meta titles, alt tags etc
Tools for Semantic Search
SMA Marketing have done a cool YouTube video about Semantic Search and they recommend tools including:
Wordlift
Frase
Advanced Custom Fields for WordPress
Google Colab with a SpaCy
Before you publish a post – look at the search results for the keyword(s) you are optimising the post for. Check in incognito in Chrome to remove most of the personalisation of the results.
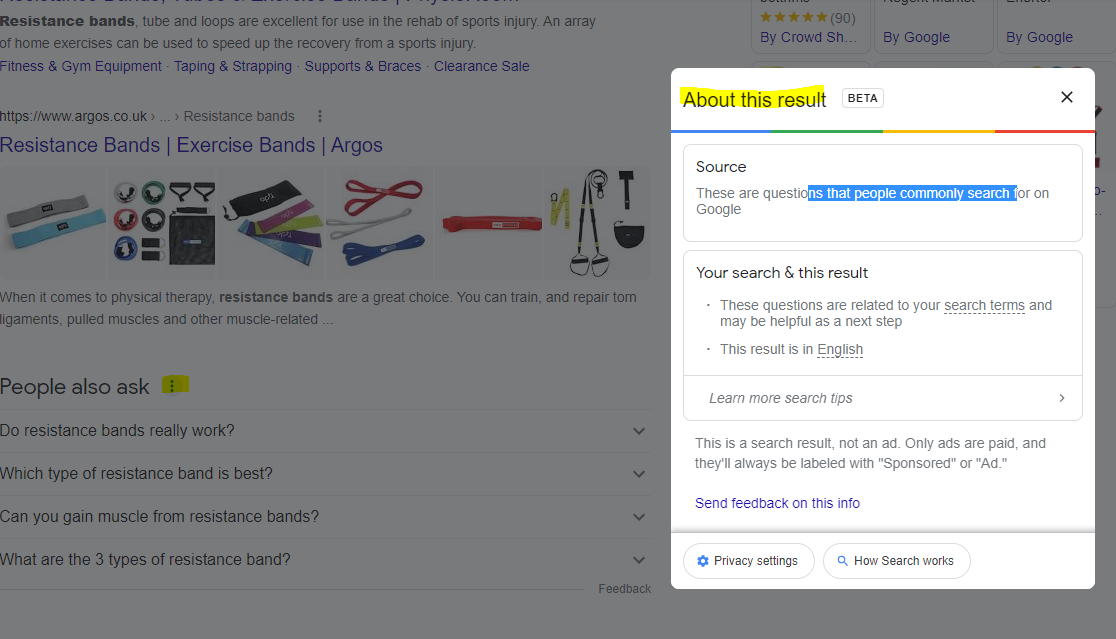
For any answer boxes or snippets, you can click the “3 dots” to get information about the results:
As well as the snippets, you can click the 3 dots next to any organic result. Here’s another result for “MMA training program pdf” with some additional information:
With this in mind – if you are looking to rank for “MMA training program pdf” then you will want to include the search terms highlighted in the “About this result” box: mma, training, program, pdf and ideally LSI keywords “workout” and “plan”.
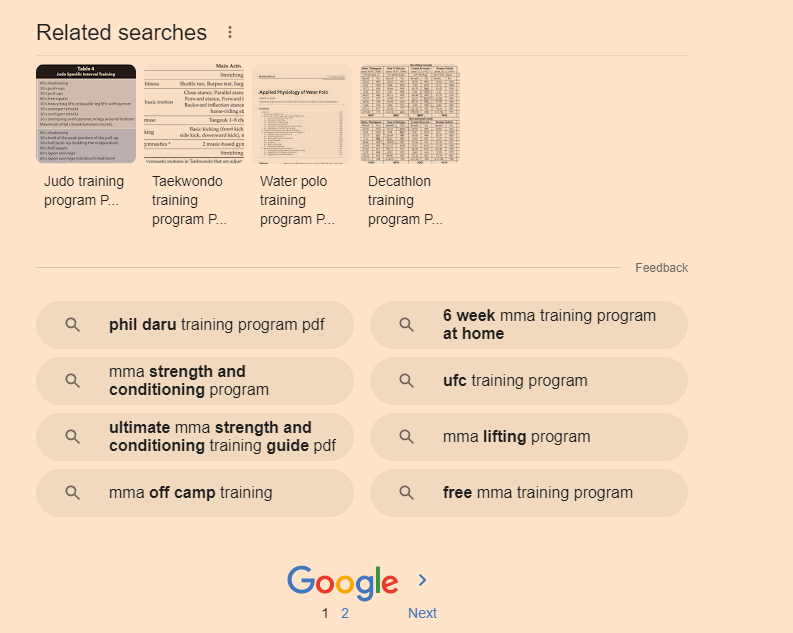
It’s also a good idea to scroll down to the bottom of the SERP and check out the “related searches”
Take a look too at any breadcrumb results that pull through below the organic listings. Combining all this information will give you a good idea as to what Google understands by your search query and what people are looking for too.
Hover over [1] and click the play icon that appears (highlighted yellow in screenshot below)
When that section has finished loading and refreshing, scroll down to the “Installation tensorflow + transformers + pipelines” section and click the play icon there.
When that’s finished doing it’s thing, scroll down again, and add your search query to the uQuery_1: section:
add your query and then press the “play” button on the left hand side opposite the uQuery_1 line
You should then see the top 10 organic results from Google on the left hand side – in the form of a list of URLs
Next, you can scrape all the results by scrolling down to the “Scraping results with Trafilatura” section and hover over the “[ ]” and press play again:
Next, when the scraping of results is done – scroll down to “Analyze terms from the corpus of results” section and click the play button that appears when you hover over “[ ]”
Next! when that’s done click the play button on the section full of code starting with:
“df_1[‘top_result’] = [‘Top 3’ if x <= 3 else ‘Positions 4 – 10’ for x in df_1[‘position’]] # add top_result = True when position <=3 “
Finally – scroll down and click the play button on the left of the “Visualizing the Top Results” section.
On the right hand side where it says “Top Top 3” and lists a load of keywords/terms – these are frequent and meaningful (apparently) terms used in the top 3 results for your search term.
Below that, you can see the terms used in the results from 4-10
Terms at the top of the graph are used frequently in the top 3 results e.g. “Mini bands”
Terms on the right are used frequently by the results in positions 4-10
From the graph above, I can see that for the search term “resistance bands” the top 3 results are using some terms, not used by 4-10 – including “Mini bands”, “superbands” “pick bodylastics”
If you click on a term/keyword in the graph – a ton of information appears just below:
e.g. if I click “mini bands”
It’s interesting that “mini bands” is not featured at all in the results positioned 4-10
If you were currently ranking in position 7 for example, you’d probably want to look at adding “mini bands” into your post or product page
You can now go to the left-side-bar and click “Top 25 Terms” and click the “play icon” to refresh the data:
Obviously – use your experience etc and take the results with a pinch of salt – some won’t be relevant.
Natural Language Processing
next click on “Natural Langauge Processing” in the side-menu
Click the “play” icons next to “df_entity =df_1[df_1[‘position’] < 6]” and the section below.
When they have finished running click the play icon next to “Extracting Entities”
Click “play” on the “remove duplicates” section and again on the “Visualising Data” section
This should present you with a colourful table, with more terms and keywords – although for me most of the terms weren’t relevant in this instance 😦
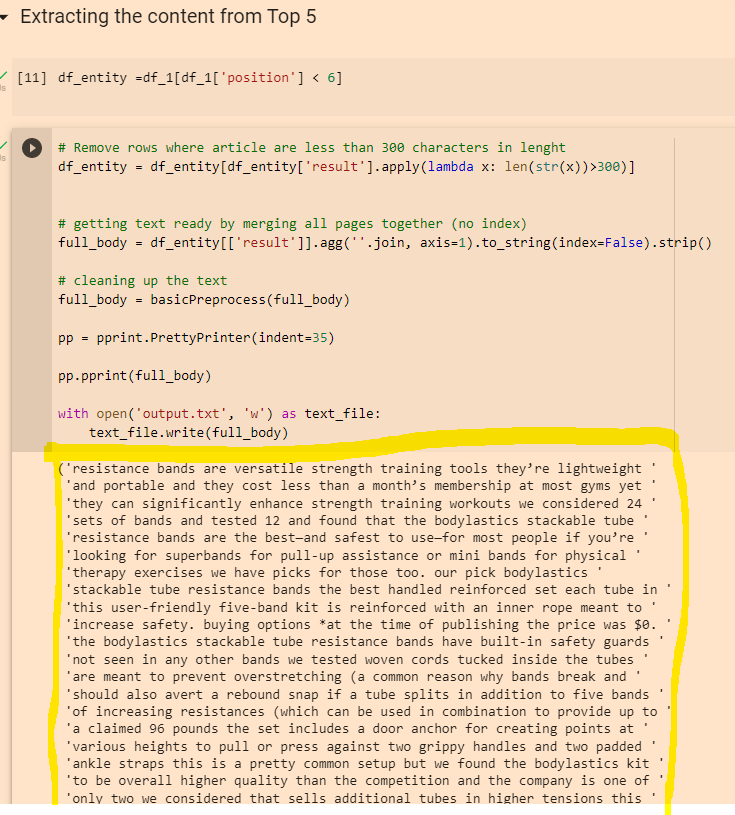
You can also copy the output from the “Extracting the content from Top 5” section:
Then paste it into the DEMO/API for NLP that Google have created here:
You can then click the different tabs/headings and get some cool insights
Remember to scroll right down to the bottom, as you’ll find some additional insights about important terms and their relevance
The Google NLP API is pretty interesting. You can also copy and paste your existing page copy into it, and see what Google categories different terms as, and how “salient” or important/relevant it thinks each term is. For some reason, it thinks “band” is an organisation in the above screenshot. You can look to improve the interpretations by adding relevant contextual copy around the term on the page, by using schema and internal links.
An Analytics account is your gateway to Analytics. An account can include multiple properties and property types, but a property can belong to only one Analytics account.
A property lives within an account. Properties are the containers for your reports based on the data you collect from your apps and sites. It’s the level at which Analytics processes data and where Analytics can connect with other Google products, like Google Ads.
A data stream lives within a property and is the source of data from your app or website. A property can have one or many data streams.
When structuring your Analytics account, remember this guiding principle: Each property should represent a specific user base.
Use separate properties to collect data from each user base you’re interested in understanding better — for example, a specific brand or region.
The new version of Google Analytics – Google Analytics 4 – has less pre-made reports and users are prompted to customise their own dashboards and use the search function.
You can literally ask questions, using the search bar. Which is fun.
Instead of pageviews and sessions, GA 4 is built around events.
Pre-configured reports are limited in GA 4. It’s a good idea to have Universal Analytics in addition to GA4
You can’t yet link GA 4 to Search Console
You can Can store raw data in BigQuery
when you install GA4 on your site, the reports don’t import data from GA universal – start from scratch – no historical data is passed over to GA4 when you install it on your site.
GA4 is Built Around Events.
Events:
You can track pageloads, elements clicked, product details, and loads more
Parameters:
Parameters are info that are sent to GA4 with the events.
Eg. Pageview is sent to GA4 with URL of the page, page title and the referral details
Automatic Events:
First Visit – first time someone visits site (this even populates the new user report too)
Page View – same as normal pageviews
Session Start – new session after 30 mins of inactivity
User Engagement – starts whens someone on your site for at least 10 secs
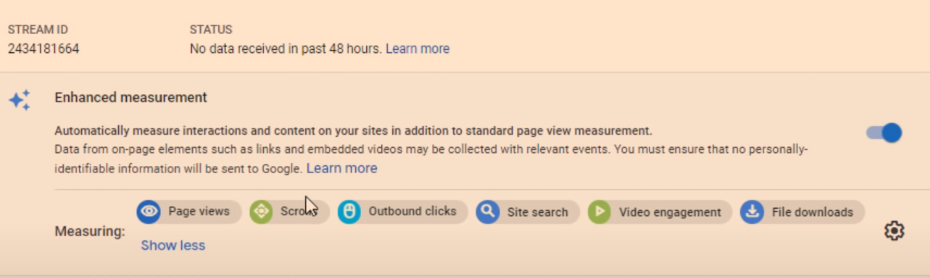
Enhancement Measurement
GA4 automatically tracks:
Scrolls – 90% of a page
Outbound Clicks –
Site Search – search queries
Video Engagement – for embedded YouTube videos
File Downloads
To edit the Enhancement Measurement reports go to “Data Streams” in the Admin area:
Click on data stream and check to see that “Enhanced Measurement” is switched to the on position. If you click on the cog icon, you can then switch different measurements on and off.
They’ll be set to “on” by default.
There are advanced settings for pageviews and site search – just click “Show advanced settings”.
Recommended Events
Google provides a list of recommended events for all websites and apps, and then by industry.
Retail & eCommerce
Jobs, Education, Local Deals & Real Estate
Travel
Games
Custom Events
Custom events allows you to name your events.
Google’s naming convention is probably best to copy – [action]_[object/item]
For example, if you create an event to track when people rate your website, call it:
Rate_item
Instead of
Product-rate
Add parameters such as product, item_id and rating – so you know which product is rated and what rating the user gave it.
You’ll need to register the parameters as custom dimensions or metrics
To make a new event – in the left hand nav/side bar – click –
Events – Create Event – Name the event
Enter the parameters to tell Google when to trigger the new event
E.g. page_location – contains – thank-you
Click “create” in top right corner.
You can create brand new events in Tag Manager – rather than basing them on existing events
Data Settings>Data Retention
By default GA4 only stores data for 2 months – in the Admin area, you can change this to 14 months.
Go to Admin>Data Settings>Data Retention and change it to 14 months on the drop down menu.
Brief Run Down of GA4 Reports (in the left hand side-menu)
REPORTS
Acquisition Reports – Where are visitors coming from? Looks at channels e.g. organic, and New Users Vs Returning Visitors
Click the “+” above the table, to add an additional dimension
1. Click the + above the table on one of the reports:
2. Add an additional dimension to the table, e.g. Page/Screen > Landing Page
Engagement Reports – What are visitors doing on your site?
To see pageviews and users per page:
Reports>Engagement>Pages and Screens
Monetization – New term for eCommerce Reporting in GA 4
See what items people are buying and how much money their spending
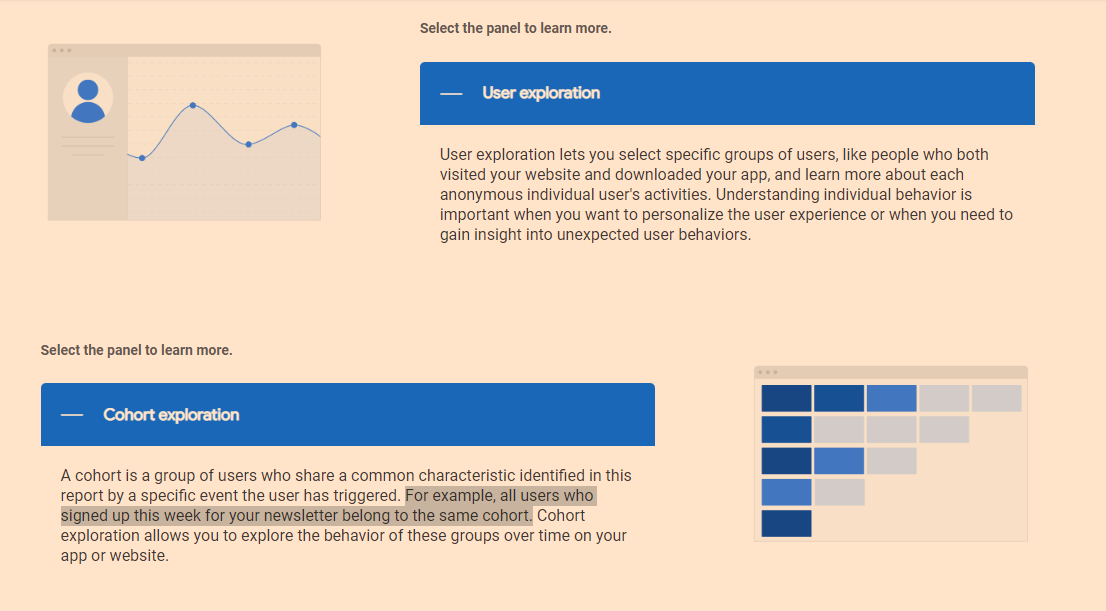
Retention – Looks at new users/visitors and returning visitors. See what percentage of different cohorts come back to the site etc
Demographics – Where are people based and what type of people are coming to your site?
Tech – what computers, tablets and phones are people using?
EVENTS
Conversions – conversions can be customised. But typically include “Begin_checkout” and “purchase”
All Events – basically less important events – compared to conversions. Include clicks, scrolls etc.
EXPLORE
Analysis – There is a Template Gallery (top right of screen)
You can look into funnels, acquisition etc and get cool reports
CONFIGURE
Audiences – you can build different audiences by location, device etc and analyse them
Remember, a property is the container for your reports based on the data you collect from your apps and sites.
A data stream lives within a property and is a source of data from your app or website.
Once you’ve identified a user base you’re trying to measure, create a property for that user base.
Then create a data stream for each of the ways these users interact with your business. For example, if you’re an app developer, you could create one data stream for your iOS app, one for your Android app, and one for your app’s marketing website.
Conversions are events that are assigned a value – such as a purchase, a lead or a download.
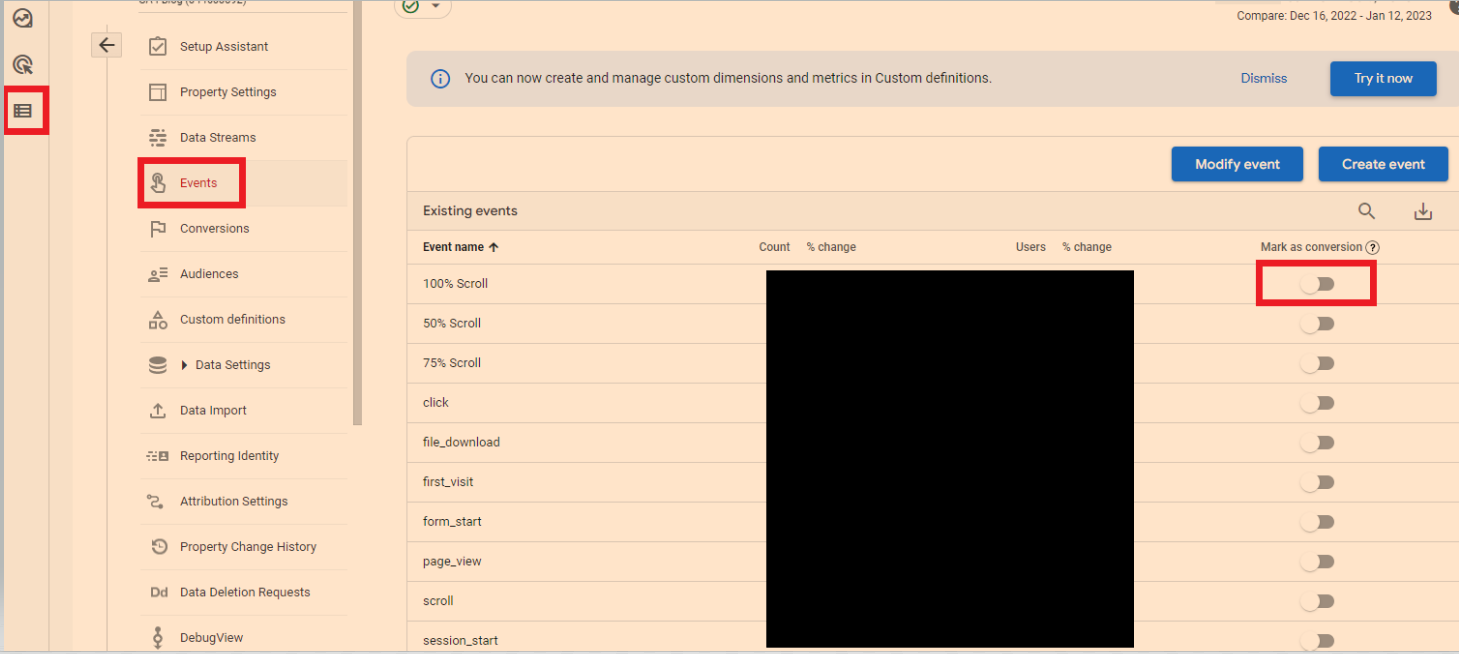
To mark events as conversions
In the left-hand side-menu, go to the bottom option “configure” – then “go to admin”
Click “events”
You can now turn on events like 100% scroll, to conversions.
Modelled Conversions
Browsers that don’t allow conversions to be measured with third-party cookies have conversions modeled based on a website’s traffic. Browsers that limit the time window for first-party cookies have conversions (beyond the window) modeled.
Some countries require consent to use cookies for advertising activities. When advertisers use consent mode, conversions are modeled for unconsented users.
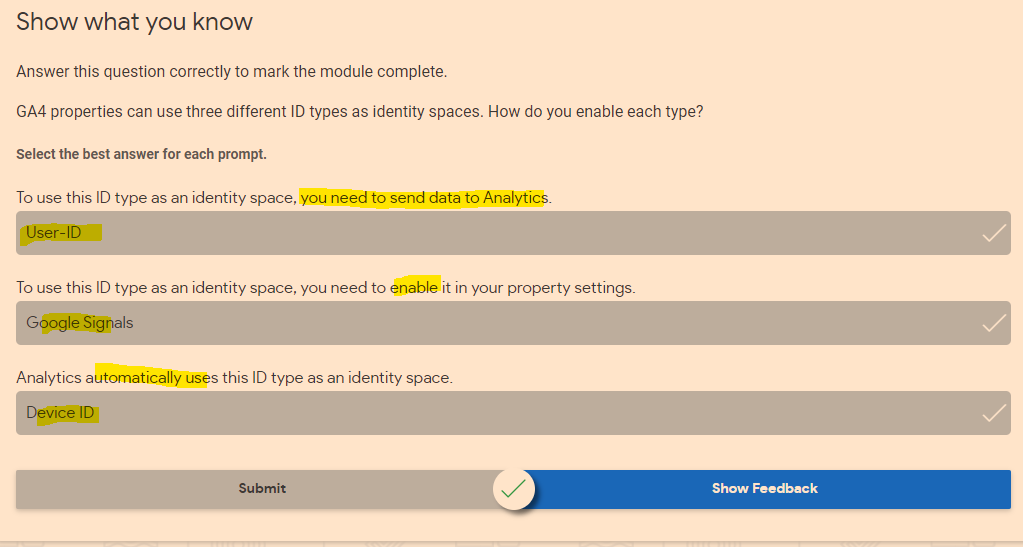
When trying to understand user journeys, Analytics can use several different user identifiers, such as the IDs you assign users logged into your website, Google signals, and device ID. These groups of identifiers are called identity spaces.
Reports & Explorations
Free From Exploration
The free form exploration allows you to visualize your data with flexibility and ease.
To conduct an ad hoc analysis, just drag and drop the variables you’re interested in onto a canvas to see instant visualizations of your data. Don’t see the variable you’re looking for? Select the plus icon to view the full list of dimensions and metrics you can use.
This tool presents your data in a cross-tab layout, where you can arrange the rows and columns as you like and add the metrics you’re most interested in. You can also apply different visualization styles, including bar charts, pie charts, line charts, scatter plots, and maps.
If you spot a significant data point, right-click on that data point to easily create an audience or segment from it and use it in other explorations. If you use the line chart visualization, you’ll see an automatic feature enabled called anomaly detection. This feature uses machine learning to identify outliers in your data according to your parameters.
Funnel Exploration
Funnel exploration lets you visualize the steps your users take toward a key task or conversion. This tool helps you identify sequences of key events and understand how your users navigate these steps. You’ll be able to see where users enter your funnels, as well as where they drop off.
You can use this information to improve your site or app and reduce inefficient or abandoned customer journeys. You can also easily create audiences of users based on where they enter or exit the funnels you define.
With this tool, you can define up to 10 steps in your funnels, up from five steps in UA properties’ Custom Funnels. Plus, you can now analyze both closed funnels (where users must enter at the beginning of the funnel) and open funnels (where users can enter the funnel at any point).
Path Exploration
Path exploration lets you understand how people progress from one stage in the customer journey to the next.
Like funnel exploration, path exploration uncovers the steps users take through your site or app. But while funnels only analyze a single, predefined path, path exploration is free-flowing and can follow any number of undefined paths, even ones you weren’t aware of or didn’t intend. For example, it could uncover looping behavior, which may indicate users becoming stuck.
Plus, you can define paths using either a starting point or an ending point. This helps you understand how users got to a certain step on their journey and shows you what they did after.
Segment Overlap
Segment overlap lets you compare up to three user segments to quickly see how those segments overlap and relate to each other. This can help you isolate specific audiences based on complex conditions. You can then create new segments based on your findings, which you can apply to other exploration techniques and Google Analytics reports.
Explorations are private by default. If you’re the creator, only you can view and edit them unless you choose to share.
Understand the Analytics property structure
You can use GA4 properties exclusively for web data, exclusively for app data, or for both app and web data together. No matter what your setup is, it’s important to understand how to structure your new Analytics property.
Introducing data streams
Data streams are a feature of GA4 properties that allow you to connect a single Analytics property to the various places where your users interact with your business. For example, a company that has both a website and an app would need a separate data stream for each platform to combine their reporting and insights into a single Analytics property.
Once you have set up your GA4 property and data stream(s), you can add different events.
For an eCommerce store, Google recommends setting up:
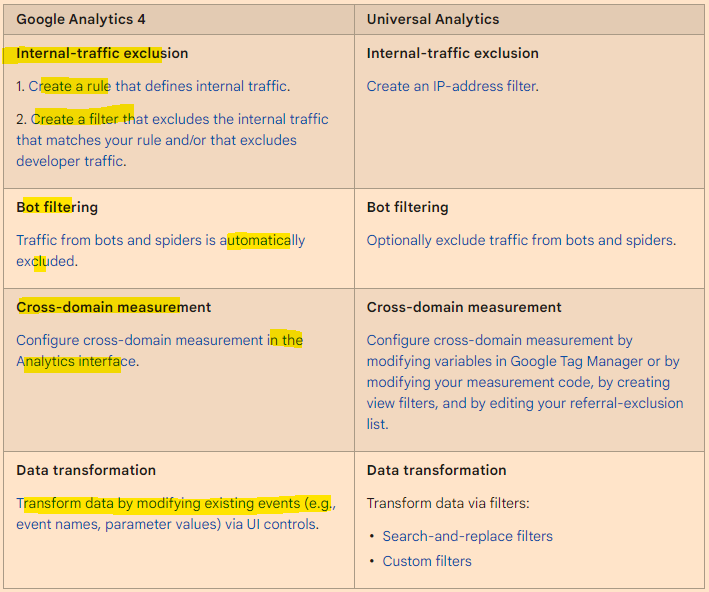
Google Analytics 4 filters are applied at the property level, and affect data from all data streams in that property. All reports for a property use the same filtered data.
Analytics collects and stores user interactions with your website or your app as events. Events provide insight into what’s happening on your website or app, such as page views, button clicks, user actions, or system events.
Conversions
It’s easy to create conversions, from events.
Got to EVENTS in the side-bar/menu on the left of GA4, then “All events”.
You can then mark existing events as conversions:
See also:
GA 4 SEO Reports – for step by step instructions on setting up some useful SEO reports in Google Analytics 4
Speed Up Data Studio Reports (Significantly) – Extract Data
To speed up your reports – you can “Extract Data” and cache it.
It can help to have 2 copies of the report up – so you can see which metrics and dimensions you need to select when adding the data to extract and cache (also a good idea to test the extract data method on a copy of the report in case you faff anything up)
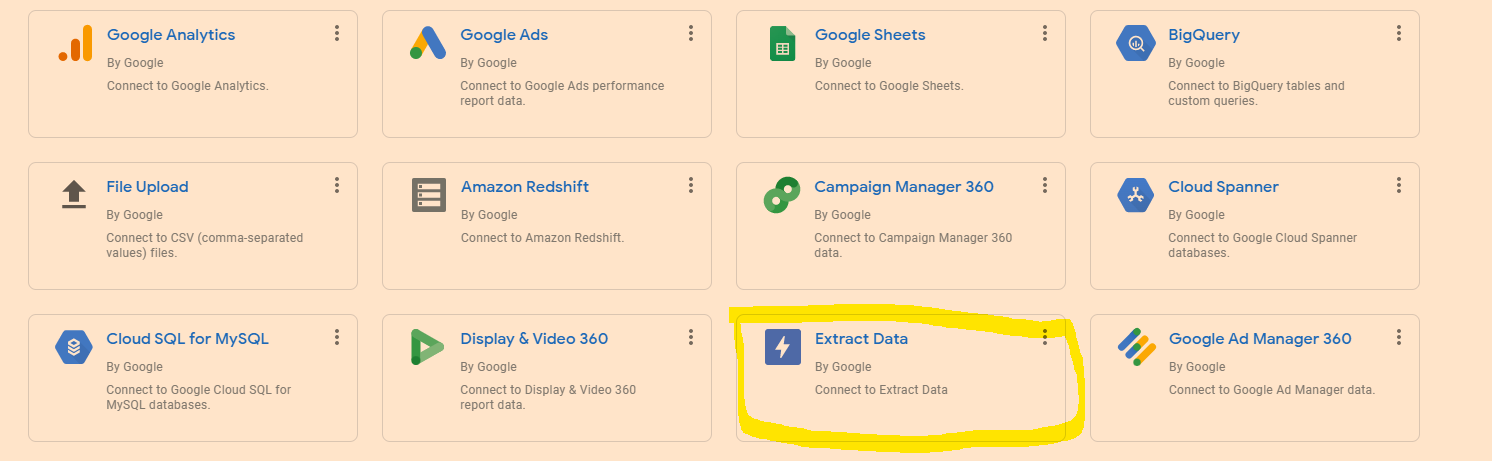
Go to “Add Data” in the top menu-bar
Click on “Extract Data”
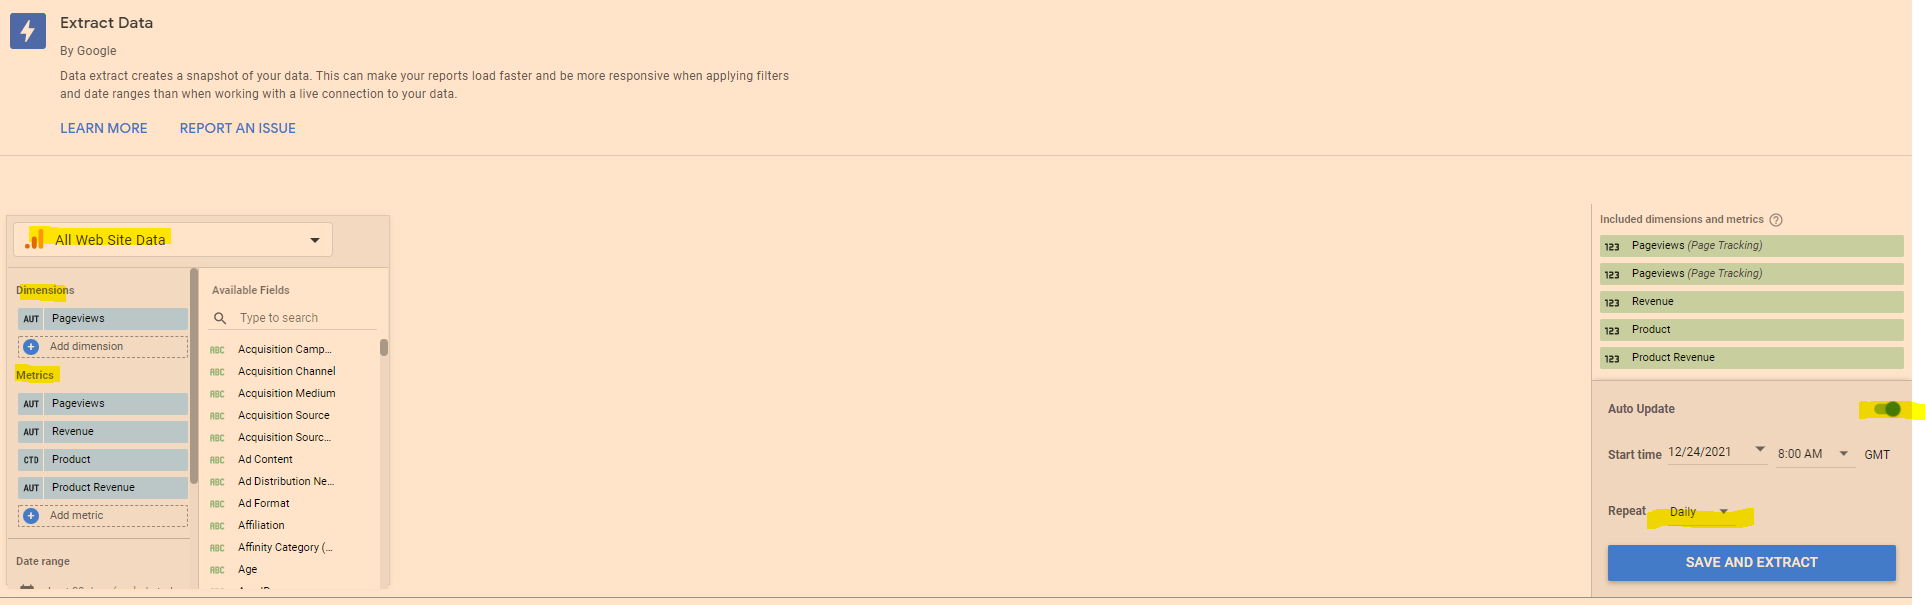
Choose the data you need – eg Google Analytics
Add the dimensions and metrics you need for the report
On the Right hand side – click to turn “Auto Update” on
Select “daily”
Click “Save and Extract”
Sometimes you have to faff around a bit with the dimensions – Google Analytics doesn’t seem to like caching a dimension, but still goes super-quick if you cache the metrics only.
Edit in Bulk
If you want to edit all of the charts or tables on the page, in “Edit” mode, right click – go to “Select” and then choose “Tables on page” or whatever type of chart, scorecard or table you’ve selected.
This works instead of CTRL clicking or SHIFT clicking – but you can only change charts or visualisations of the same type at the same time. You can change the style, add a comparison date range etc.
Brand Colour Theme in Data Studio
Click on “Them and Layout” at the top of the screen and then, near the bottom right click “Extract Theme from Image” – you can then upload your logo and choose a theme with your brand colours.
If your shite at presentation like me, this is helpful.
Copy & Paste Styles
In Data Studio – If you want to copy a style from a chart or table, right click it, then choose “copy”
Click another chart/table and the right click – Paste Special – Paste Style Only
Add Chart Filters to an Entire Report
If you want to add a filter to all the data in a report, then it can be a pain going through the charts individually.
Right click on a blank part of the page –
Click “Current Page Settings”
On the right hand side – click “Create a Filter”
Choose or create a filter to apply to all the page
To add a filter to multiple pages
Right click on a blank part of the page
click “Report Settings”
click “Add a filter” in the right side-menu
Add Elements to All Pages of a Report in Data Studio
If you want to add a header and date range selector, for example, to all the pages in the report – add the elements to a page, then right click on the element – and choose “Make report-level”
Quickly Align Elements in Data Studio
Click and drag to select all the elements
Right click – choose “align” – “middle” to get everything inline horizontally
To get an equal space between all the elements, so they’re spaced evenly:
– click and drag to select the elements
– right click – select “Distribute”
– “horizontally” to space evenly across the page, or “vertically” to distribute evenly in a vertical manner.
You can also tidy up individual tables to align the columns vertically – right click and select “”Fit to data”
For lead generation websites, if you are a local tradesman for example, you’ll want a Call to ACTION button on the homepage, and probably all of your other pages – a Contact Now button for example
Homepage Call to Action
Strong Call To Action
You will probably want a “Call to Action” or “CTA” button, such as “Buy Now”, “Learn More” or “Contact Us”
This CTA button is generally placed “above the fold” on most pages, so that people don’t have to scroll down or look for a way to get in touch or buy from you.
“Join Free for a Month” – is the CTA on Netflix’s homepage (at the time of writing)
For more expensive, high end or though-out purchases such as – buying a car or contacting a therapist, sometimes it’s better to have the CTA below the fold. The best thing to do is test it, with Google Optimize.
For more information about “Conversion Rate Opimization” (CRO), see this article:
For a full SEO (Search Engine Optimization) checklist for your website – to help get visibility on Google – see this article – https://backlinko.com/seo-checklist
Google My Business
Register your website and your office with Google My Business
Google will send out a postcard to your office (or home) address
The postcard has a code – so you can confirm you are at that address
Local Directories
Register your business with high quality, local directories such as
Bing Places
Yelp
Yell
Free Index
Open Di
Try and get on any local government directories too.
Social Media & Captioned Videos
If relevant, register your business on:
Linkedin
Facebook
Instagram
TikTok
Arguably the best way to get noticed on social media at the moment, is to create videos with captions – so they can be watched on mute.
Linkedin is said to have the greatest organic reach at the moment too – meaning you can get your video, image or text-post in front of more people, without paying for ads.
Social media sites like people posting videos too – because they drive a high rate of engagement and keep people on the site for longer.
Do NOT post to YouTube and then post a link on social media
Instead – upload your video direct to the platform.
For example, if you have a Facebook page, upload the video directly to Facebook, so that Facebook hosts the video and not YouTube.
Social media sites will tend to kill your reach if you post a link – they don’t want people to click and leave their website
YouTube is also showing on more and more Search Results Pages on Google.
Consider creating a YouTube channel with lots of informative, helpful and entertaining content.
You can then edit the videos and post to specific social media platforms.
Find out the pain point of your target audience and create video content that helps with those pain points.
Take long form videos and edit them into YouTube shorts, and shorter clips for social media.
If you work in b2b for example, you could do a webinar on digital marketing for small businesses, create some 1 minute highlights of the most informative points and create a YouTube short, and create lists of 30 second clips for tiktok, Facebook, twitter, Instagram and LinkedIn.
Make sure you add captions to your videos for social media!
80% of social media videos ate watched muted.
Jab, Jab, Jab – Right Hook
General principle of content and social media marketing by Gary V.
Identify your target market
Identify their issues and pain points
Post helpful content related to their pain points and problems
Do NOT constantly promote your business – slip in the odd “Right Hook”, every 3 or 4 posts
People do not want to be sold to constantly, they want helpful, insightful and funny content.
For example.
If you target market is small business owners, take a look on Quora and Reddit and see what people are talking about. If a common theme is Facebook advertising for example, make some helpful videos and blog posts about Facebook marketing.
SEO, PPC and More
The above is just a foundation.
If you have the time and resources, you will ideally produce lots of insightful blog content, earn lots of inbound links and work your way to the top of Google.
You will also want to consider “PPC” – Pay Per Click ads on Google, Facebook and Linkedin.
One beginner mistake to avoid with ads – is sending people to your homepage.
Have a specific “landing page” for each advertising campaign.
oh – make sure you have a good looking logo too. You can use Canva or hire someone on PeoplePerHour.com
Google ads is changing all the time, but generally speaking you’ll want to use exact match keywords and create very specific ads for each keyword or group of keywords.
A good place to start with SEO is to check your website using an On-Page SEO Checklist.
Videos can also be used as aa way to gain presen o Google.
Videos are great for social media, and YouTube is also starting to show more and more often in the Google results. I would personally have a good go at gaining an online presence using videos and social media – particularly Linkedin at the moment.
Build a Brand
Here’s a good article that some hero wrote about building your brand as a small business
Identify other propositions “why use me/us and not the competitor?”
Write down your brand story
Use high quality photography & videography (avoid stock pictures)
Consider making customer support a key element of your brand – this can help with online reviews too. Pre-purchase, purchase and post-purchase consumer stages are all opportunities to impress and help.
Just use SEMRush – Organic Research – Positions tab and download and pivot the pages data – no need for advanced filter
Once you’ve found the blog posts with the most traffic, you can analyse the “Exact URL” in SEMRush
This analysis, should show you the keywords on the page that generate most of the search traffic
I personally like to go after KWs with a Keyword Difficulty score of less than 20 for my personal blog and under 30 for my employer’s blog
You can also use Reddit & Quora for Content Ideas
Unsolicited #SEO tip: You can get great ideas for specific content ahead of features like PAAs being generated by using Google site operators with specific sites. For instance, I can use the command:
site:reddit[dot]com/r/amateur_boxing “how do i”
or
site:reddit.com/r/bootroom “how do i”
To search just the amateur boxing subreddit for questions starting with “how do I?” You can apply this on any niche or on other sites like Quora to get up to the minute questions people are asking.