
Google Analytics Tutorial 2016 for Beginners
To get started
Sign up for Google Analytics – http://www.google.com/analytics/
Once you’re done and signed in, you’ll be given a piece of tracking code
Add the tracking code to all of the pages on your site
Link your account to AdWords (if you use AdWords)
You need to set up a “property” and a “view” for your website:


The property is usually just the name of your website, and the View is a set of reports; at this point it’s not worth worrying about, unless you work for a business with multiple analytics users who may require different “Views” and reports; or have lots of domains to track.
You can also Link Google WebMaster Tools with Google Analytics
– Log into Google WMT
– On the Homepage, you should see a list of your websites – click “Manage Site” on the right hand side
– Click “Google Analytics Properties” and click to link Google WMT with a Google Analytics property
– This will enable you to see keyword data, for the Queries report, which falls under Acquisition, Search Engine Optimization
For WordPress websites –
Got to Plugins – Add New – Search “Google Analyticator”
click Activate
Go to settings Menu -> Google Analytics – then add you Google Analytics UID – it will look something like:
UA-1222432-37
To add users, click on the Admin button on the right of the main orange bar at the top, and then “User Management” under the Property column.
For Free WordPress.com websites (like this one)
You can get Webmaster Tools easily, but I’m not sure about GA.
Go to Tools – Available Tools, and paste your WebMaster code in the corresponding box:

Some Terminology
Dimensions & Metrics
Dimensions – these are the “what” – e.g. Search Term, Page, Page Title, Geographic Location of visitors. They are more ‘wordy’ and qualitative than metrics.
Metrics are the numerical measure – e.g. Number of – Pageviews, New Visits, the Time on Page, the Bounce Rate. Anything that can be expressed as a time, percentage or a numerical amount.
Bounce Rate – the percentage of people that view only one page of your site, or the people who viewed a page of your site, then left your site. High Bounce rate, suggests site is not relevant to what people are looking for. Common on blogs to have a high bounce rate though.
Visit or session – the period that someone is using your site.
Visitor / User– identified by a cookie. This is what makes it different to unique pageviews; which uses sessions not cookies to count how many have been created.
PageViews – the number of times a page is viewed
Unique PageViews – the number of times a page is viewed; but during different sessions
e.g. if Dave goes a views my homepage, then looks at an article for 10 mins, then navigates back to the hompage. That’s 2 PageViews for my homepage, but only 1 Unique PageView
Difference Between Unique PageViews & Visitors
If Alan visits the same page twice, during the same session, then that will count as 2 Pageviews but only 1 Unique PageView.
If Alan came back after 30 minutes of inactivity (session has expired), and views the page again; that would count as 3 PageViews, 2 Unique PageViews, but only 1 Visitor/User.
Visitors/Users are indentified by cookies
Unique PageViews are distinguished by sessions

Direct Traffic – visitors that arrive directly, by typing in your URL into the address bar
Referral Traffic – comes via a link on another website
Search Engine – Someone uses google, bing, or yahoo to find your site
Organic – Free Search Engine Traffic CPC – adverts, like Google AdWords
ROI – Return on Investment
ROI of 0% means your expenditure/cost on adverts, was the same as the income it generated
ROI of 100% means that your related income was double that of the cost of the adverts
Sessions are basically visits to your website. By default a session ends when the visitor is inactive for 30 minutes, or leaves your site.
Once you’re logged in – Getting Started
The DashBoard is where you summarise all your favourite information

Add more widgets/graphs by clicking “Add to Dashboard”

An Ace time saving feature for Dashboards:
On the orange header-bar click “Customization”

Then click “Import from Gallery”
Then you can import a dashboard template, which will save you having to set one up yourself. It will of course, populate itself with your data
To see all the different reports available:
On the left hand menu, click the headers, e.g. “Audience” to reveal all the possible reports


To change the dates on a report:
Click the date drop down menu on the top right hand side

Then you can click on 2 dates to put a date range in, or tick the “compare to: ” box, to compare to date ranges, e.g. year on year for a particular month

You can see 2 metrics on 1 graph by clicking the “Select a metric” near the top of the graph area

To download data:
Click on the Export button (above the select a metric text), to export the date from Google Analytics

To send reports:
To the left of the Export button, is the Email button.
If you click that, you can choose to have reports sent at a certain frequency

For different presentations of data on reports:
Click the different graph icons, to display different types of graphs:

For Segments – adding filters to the report data:
Use the downward arrow, near the top left, for Segments

Choose which metrics and dimensions you want, and click Apply

To create your own segment, click “create new segment”

Then choose which filters you want, and what metrics or dimensions you want to choose and filter:

Decent & Useful Reports
Check out the Site Content reports, under the Behaviour header/section

Below is a screenshot of the report, it shows all the pages on your site (that have had visits). The forward slash /, represents my homepage (obv not the homepage of this amazing blog, it’s for whichmmagear.com).

The Landing Pages report shows what pages people ‘land on’ to get to your site, and Exit Pages shows which pages people leave your site from.
Easiest Way to Get Visits to Each Landing Page Report
On the Acquisition Menu, click “Channels”

Under the horizontal Primary Dimension menu, click Other

From the dropdown menu search for landing Page, and click it when it appears in green:

Then search for the URL you are looking for in the search box just above the table

Users / Visitors Per Page/URL Report
If you want visitors per URL, not unique pageviews, or visitors to the landing page; then you have to make a custom report.
This seems mad, because surely visitors per URL is one of the most common report required?
Anyway, to make a custom report, go to Customization tab/button on the top (next to Home and Reporting)
Click +New Custom Report
Fill in a Title
+add metric Group – choose Visits
+add metric Group – choose Unique Visitors
+add dimension – choose page
Then click save
You should then see visits for each URL. You can change the date range etc. in the usual way, by using the date picker in the top right.

The AdWords reports are under the Acquisition section:

Visitor Reports
Under the Audience header, at the bottom is Visitor Flow.
It shows the paths that people have taken to get to your website. Which sites they stopped at along the way.
Hover over a green part, and a pop up tells you how many people dropped-off at each site

Dealing with the Tables
Couple of tips:
– You can reorder the list by clicking column headers

Then a small arrow should appear to the right of the column heading. You can sort in reverse order by clicking, waiting for it to order, then click again. Don’t double click.
Change the primary dimension easily with the little blue headings above the table:

– Use “weighted” sorts, to display data by another set of data. For example, to order just by bounce rate, use a default sort to get this:

The above data, doesn’t take into account the visits when ordering the table. It only looks at the bounce rate.
Weighted sort with look at both, and in theory, put the most useful data at the top:

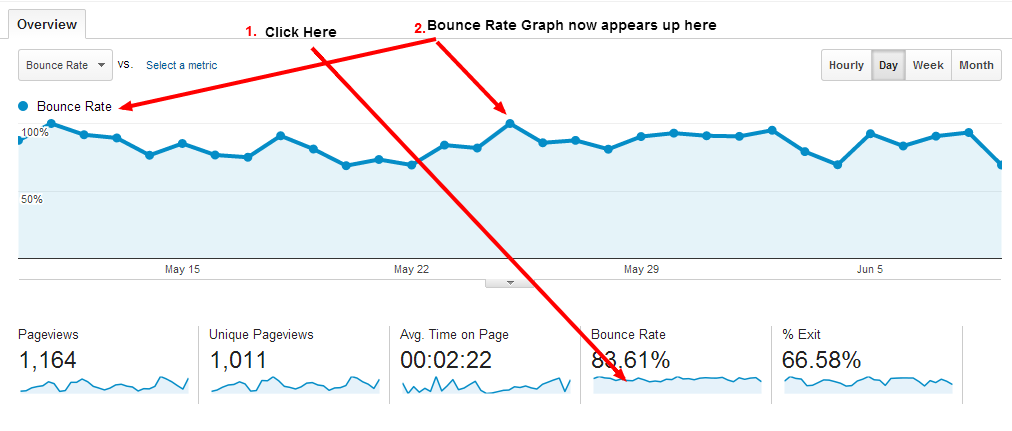
Playing with Graphs
With most reports, you can click on the statistics underneath the graph.
Click on the blue line that looks like a graph, e.g. the blue line under where it says “Bounce Rate”. This will make “Bounce Rate” populate the large graph above it:
To see Bounce Rate just for Referral Traffic:
On the pop up menu/interface, delete “All Sessions” by clicking on the box the text is within, and select “Referral Traffic”, from the list of check boxes:

next click the blue “Apply” button.
The graph will now display Bounce Rate, just for Referral Traffic.
If nothing populates the area near the top (the bit we just dragged Referral Traffic to), then “All Visits” will populate the graph by default.
Add annotations e.g. the start of a new campaign, by clicking the little arrow icon, underneath the graph:

Motion Charts
Available for most of the “Acquisition” reports
Click the icon near the top right hand side

You can click the ‘dot’ to see what it represents, in this instance, it’s Direct Traffic

Site Search
If your website has a search box:

Use the Site Search Reports, located in the Behaviour section :

Tracking Campaigns
Use the Google Analytics URL builder to tag up the URLs, so you can monitor clicks from external sites and adverts etc.
Use a spreadsheet if you need to tag lots of URLs
For AdWords campaigns, set up Autotagging.
Autagging adds a unique “gclid” tag to the end of URLs for landing pages from paid adverts
There may be more clicks on ads, than there are visits. Sometimes people will click on an advert, but will leave your website before the analytics tracking code has loaded. Redirects and incorrect tagging may also cause indiscrepencies.
Goals
URL destination goal – eg. fulfilled when the “Thankyou” page is shown to the visitor after they sign up for something or make a purchase
Pages per visit goal – goal is fulfilled when visitor views a preset number of pages
Time on Site goal – goal is fulfilled when visitor stays on your website for a set amount of time
To set up goals, click “Admin”, and the click goals

The click “Create Goal”, then fill in the required details
Funnels
– Funnels are a set of pages, like a shopping cart page, checkout page, payment page etc. that are must be viewed to fulfill a goal
– They allow you to identify “bottlenecks” and drop-out points in the process
Click Admin, then Goals, to create a funnel
Funnels are set up with Goals:

Reports for funnels are under the “Conversions” section

Filters
To set up filters, click Admin and then Filters

You can use filters, so that you display or block data from specific locations.
For example, for a company website, you won’t want the visits from your own staff showing up and skewing your reports.
You can filter out traffic from different locations and IPs

If you click on Custom filters, then you can filter by campaigns:

E-commerce Reports

You need to set up E-commerce Tracking in order for these reports to work
To do this, click Admin, then view setting on the right hand column:

Near the bottom, turn E-commerce tracking to “ON”
Next you’ll need to put the standard analytics tracking code on your receipt or “thankyou” pages; as well as the Google Analytics E-commerce code.
Here’s a video that explains it a bit more. Start from 8mins 50:
I’m not going to lie, setting up E-commerce tracking does appear to be a massive ball-ache.
The method you use depends on the secure payment provider that you use to take credit and debit card payments. Each provider will generally provide a plug-in that just needs activating, or gives you a small piece of code to add to each receipt page.
Here is the easiest to follow tutorial I could find
Event Tracking
Monitors interaction with each webpage
e.g. File downloads, games played, videos played etc.
Virtual PageViews
Get Google Analytics to register a “PageView” when a certain event occurs (that’s not an actual pageview).
So a “PageView” might be registered, when a pdf is downloaded; for example.
You’ve probably seen this code before, or similar, you need to ‘put’ it, so that it tracks events on your website:
onClick=”gaq.push((‘_trackPageview’,’pdf_download’,))”
Proper Event Tracking
You have to use the code:
_gaq.push([‘_trackEvent’,’name’,’label’,’value’]);
Examples:
To see how many times people click the download link for an SEO for beginners pdf , you would use the event tracking code:
Download SEO For All Action Heroes
Event tracking is obviously better than using virtual pageviews to monitor interaction.
You won’t inflate your PageView count by using EventTracking either.
RegEx Basics
Use RegEx to create filters and a specific type of goal.
Backslash
You see this all the time. It’s not stop “special characters” from being special. For example, a full stop will normally have a RegEx function of matching a single character, but if you put a in front of it, it will just be a normal full stop.
The dot or fullstop . matches any single character
The pipe | means match this”or”that – this|that
Use brackets to identify the optional words or characters
e.g. /folder(one|two)
The Question Mark ? means that the last item is optional. e.g. if you wanted to filter out misspellings of your brand name. For exmaple, if you worked for Lemsip and for some reason people often misspelled it “Lemmsip”, you could use the following filter
Filter – Excluding – Lemm?sip
This would exclude “Lemsip” and “Lemmsip”. Because the “m” before the ? is optional
Square Brackets []
Use these to create lists, it will match anything within the list.
[a-zA-Z0-9] will match all upper and lower case letters and numbers
D[aue]w will match Daw, Duw and Dew
The Dot Star .*
Means “get everything”
Take this list or URLs as an example:
http://www.seoandmma.wordpress.com/index.php
http://www.seoandmma.wordpress.com/index.html
http://www.seoandmma.wordpress.com/about.php
If I wanted to just return the different version of the homepages, I would use the following:
http://www.seoandmma.wordpress.com/index.*
Forward slashes in web addresses need to be ‘escaped with a backward slash hence the /
This would return:
http://www.seoandmma.wordpress.com/index.php
http://www.seoandmma.wordpress.com/index.html
Rubular – use this website to test out your RegEx
Article Written by Drew Griffiths
Recent Reports I’ve Done that I want to Make Note of!
Sources of traffic to a specific URL
Go to:
Behaviour – Site Content – All Pages – Secondary Dimension: Source/Medium – *advanced filter box “text in URI”*
Goal Completions
Go to conversion – Goal Flow
Resources:
https://www.businesstakeaways.co.uk/using-google-analytics-to-improve-your-business/
http://www.lunametrics.com/regex-book/Regular-Expressions-Google-Analytics.pdf
https://support.google.com/analytics/answer/1034324?hl=en-GB
http://www.youtube.com/watch?v=H1Opn4DS88k&list=PL953EF4F771134336
http://www.seotakeaways.com/event-tracking-guide-google-analytics-simplified-version/
http://www.quickblogtips.com/downloads/ebooks/Ben_Barden_-_A_Beginners_Guide_to_Google_Analytics.pdf

Pingback: Google Analytics 2014 | Fitness, MMA & Marketing