Data Studio – Quick Tips (Advanced)

Speed Up Data Studio Reports (Significantly) – Extract Data

To speed up your reports – you can “Extract Data” and cache it.

It can help to have 2 copies of the report up – so you can see which metrics and dimensions you need to select when adding the data to extract and cache (also a good idea to test the extract data method on a copy of the report in case you faff anything up)

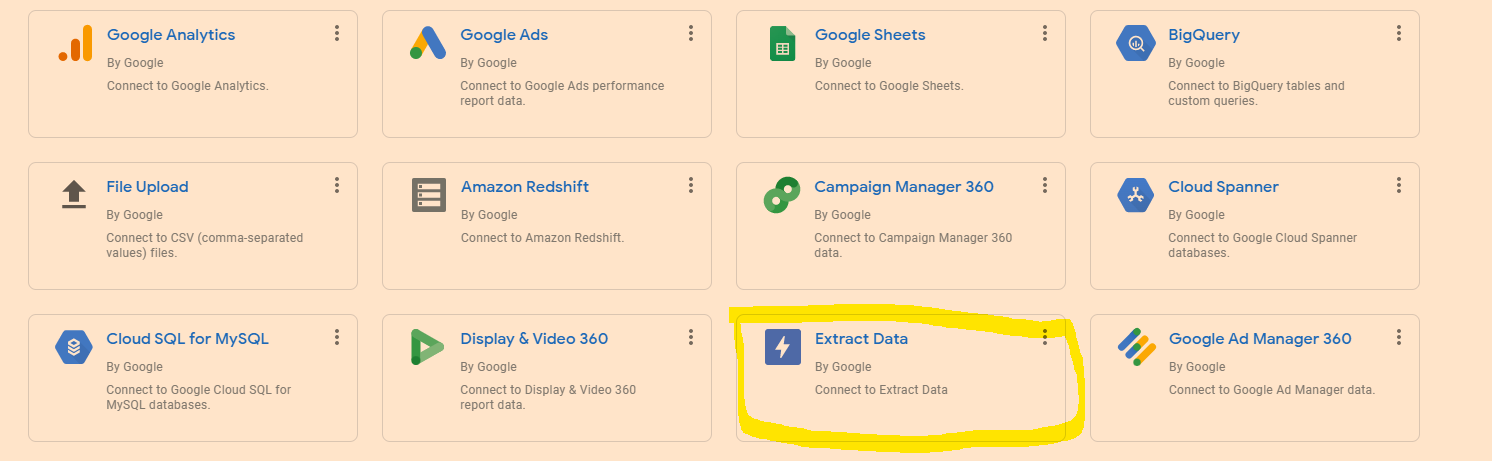
Go to “Add Data” in the top menu-bar

  • Click on “Extract Data”
  • Choose the data you need – eg Google Analytics
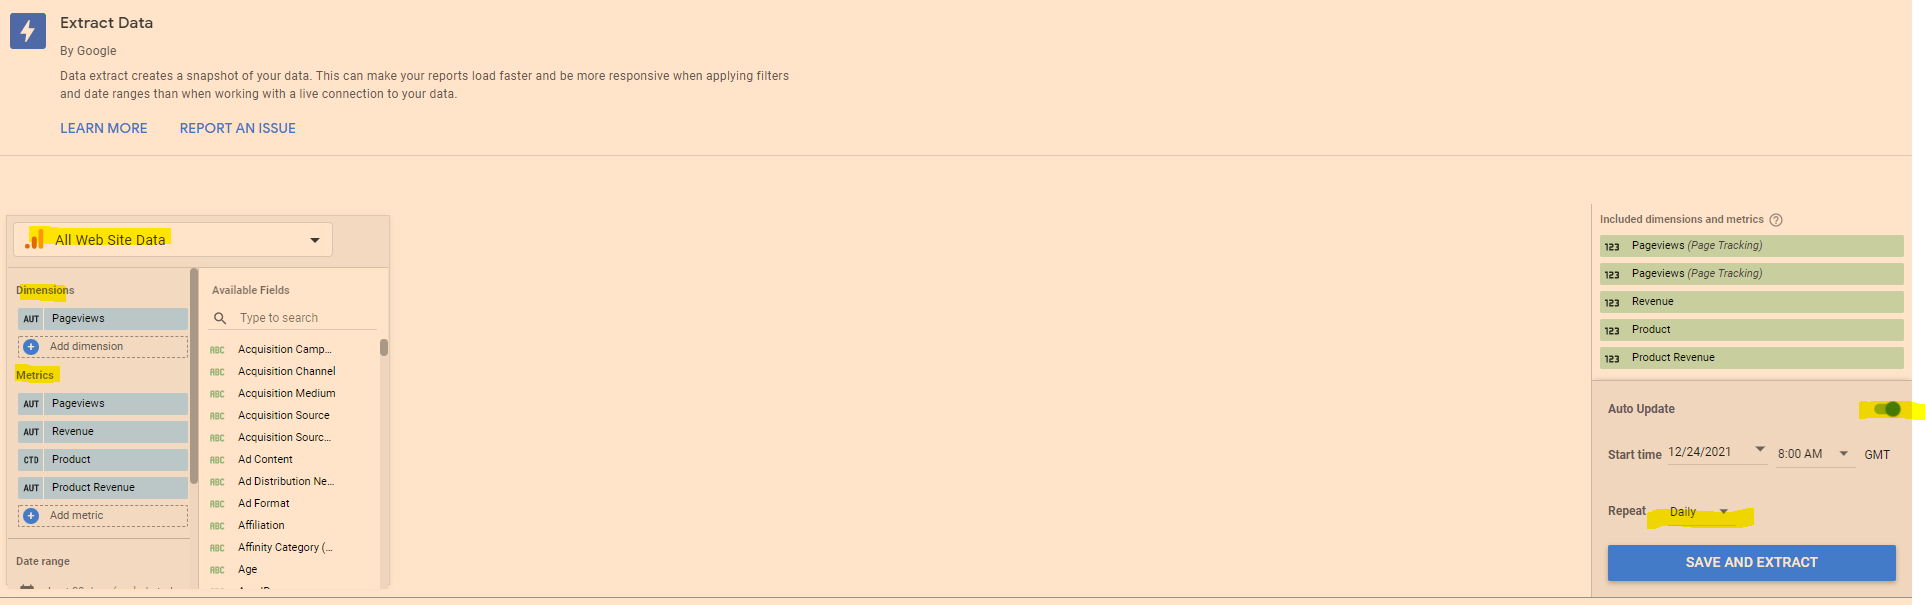
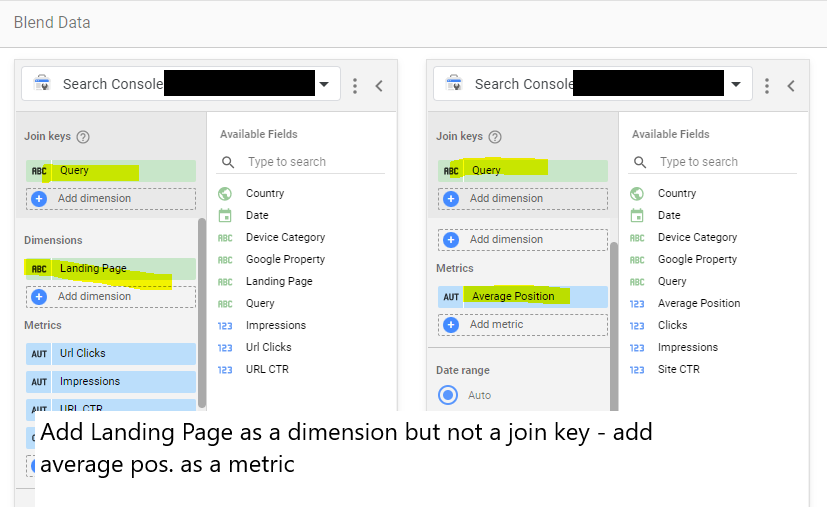
  • Add the dimensions and metrics you need for the report
  • On the Right hand side – click to turn “Auto Update” on
  • Select “daily”
  • Click “Save and Extract”

Sometimes you have to faff around a bit with the dimensions – Google Analytics doesn’t seem to like caching a dimension, but still goes super-quick if you cache the metrics only.

Edit in Bulk

If you want to edit all of the charts or tables on the page, in “Edit” mode, right click – go to “Select” and then choose “Tables on page” or whatever type of chart, scorecard or table you’ve selected.

This works instead of CTRL clicking or SHIFT clicking – but you can only change charts or visualisations of the same type at the same time. You can change the style, add a comparison date range etc.

Brand Colour Theme in Data Studio

Click on “Them and Layout” at the top of the screen and then, near the bottom right click “Extract Theme from Image” – you can then upload your logo and choose a theme with your brand colours.

If your shite at presentation like me, this is helpful.

Copy & Paste Styles

In Data Studio – If you want to copy a style from a chart or table, right click it, then choose “copy”

Click another chart/table and the right click – Paste Special – Paste Style Only

Add Chart Filters to an Entire Report

If you want to add a filter to all the data in a report, then it can be a pain going through the charts individually.

Right click on a blank part of the page –

  • Click “Current Page Settings”
  • On the right hand side – click “Create a Filter”
  • Choose or create a filter to apply to all the page

To add a filter to multiple pages

  • Right click on a blank part of the page
  • click “Report Settings”
  • click “Add a filter” in the right side-menu

Add Elements to All Pages of a Report in Data Studio

If you want to add a header and date range selector, for example, to all the pages in the report – add the elements to a page, then right click on the element – and choose “Make report-level”

Quickly Align Elements in Data Studio

Click and drag to select all the elements

Right click – choose “align” – “middle” to get everything inline horizontally

To get an equal space between all the elements, so they’re spaced evenly:

– click and drag to select the elements

– right click – select “Distribute”

– “horizontally” to space evenly across the page, or “vertically” to distribute evenly in a vertical manner.

You can also tidy up individual tables to align the columns vertically – right click and select “”Fit to data”

See our Data Studio Fields & Filters blog post – https://businessdaduk.com/2021/12/15/data-studio-fields-filters-notes/

Data Studio – Data Blending

Bit of a ball ache to work out

There are a few ways to blend data, here’s my fave:

  • Go to “Resources” in the main menu at the top
  • Click “manage blended data” option
  • Click “Add a Data View”
  • Choose a Data Source e.g. Search Console
  • Then “Add a Table” and include another data Source for blending – e.g. GA
    or click “blend data” on an existing table or chart – and select another data source
  • Choose a common “key” to both data sources e.g. “Date”
  • Choose the metrics you want from each Data Source – I wanted to get daily revenue into my search console reports:

Using the blended data above, I can now add Revenue from Google Analytics to my search console reports. I have to remember however, that the revenue is simply attributed to each day and not any queries

**Update to the screenshot –

add a table filter to get organic only revenue from GA.

To be able to filter Revenue to organic only – you need to add a “Dimension” to the table on the right – click the “+” next to “Add dimension” in the GA data and then “Default Channel Grouping” – you can then create a filter in the report:

Blending Search Console Data in Data Studio

Another common reason to blend data – is to get average position data from Search Console “Site Impression reports, added to “URL Impression” data:

URL impression vs site impression

Incidentally –

the main difference between Data Studio Search Console URL Impression Vs Site Impression data – is that Site Impression contains the Average Position metric and URL Impression contains the Landing Page metric. So when you’re blending the data from both sources, make sure you have “Landing Page” as a metric and “Average Position”.

Data Studio Fields & Filters – Notes

Once you’ve created a field – add it to your chart as a Dimension

Mixed Case URLs

Having a mix of URL cases in the letters can faff with your data as D.S. might think each capitalisation variation is a new URL:

  • Click on the Data Tab to the right – then “Create new field” or “Add a Field”
  • Name the field “Lower Source” type in “LOWER(“
  • Then add “Source” from “Available Fields” to the left
  • Click “Save” and add “Lower Source” to the table as a Dimension

Concatenate Data

  • Create or “Add a Field”
  • In the Formula box type “CONCAT” and then select the fields you want to use
  • Close the formula with the final “)” and save it

Internal Site Searches – Extract Search Query

Make the data look nicer and get the search term on its own in the table.

  • Select to a “Add a Field”
  • Use REGEXP_EXTRACT formula to pull out the search terms and get rid of “/search?q”
  • Use the REGEX shown below:

Search Queries – Pull Out Questions – What, Why, When?

  • Create / Add a New Field
  • Add REGEX as shown below and save
  • Add New Field as a Dimension to the table
  • Create a table/data Filter so that you include only table rows that equate to “True” in the new dimension/column

CASE Formulas in Data Studio

CASE formulas are basically “If this, then do that” formulas

When X happens, Then do Y

You can use the CASE Formula to classify and group channels together

For example:

WHEN query matches “who”, then display text “Who?” in the table

  • In the Formula – you need a “catch all” default for when nothing is true in the criteria
  • If the search doesn’t contain “who, what, why” etc. then:
    ELSE “others”

    So if the search term, doesn’t match any of the REGEX criteria – classify it as “others”
– Save the CASE statement
  • Add the new field – to the table or report

Date Ranges & Filter Controls

Taken me ages to work this out – I’ve only just twigged:

You can add Comparisons, Search Boxes, Drop Down Menus and all sorts to your Data Studio Reports

For controls and filters to work – you need the chart or table to have “Default Date Range” set to “Auto”

See my post about REGEX for SEO here.

Ta

If you want a pre-made Data Studio template, you can send me some money and hope for the best.