
Bit of a ball ache to work out
There are a few ways to blend data, here’s my fave:
- Go to “Resources” in the main menu at the top
- Click “manage blended data” option
- Click “Add a Data View”
- Choose a Data Source e.g. Search Console
- Then “Add a Table” and include another data Source for blending – e.g. GA
or click “blend data” on an existing table or chart – and select another data source - Choose a common “key” to both data sources e.g. “Date”
- Choose the metrics you want from each Data Source – I wanted to get daily revenue into my search console reports:

Using the blended data above, I can now add Revenue from Google Analytics to my search console reports. I have to remember however, that the revenue is simply attributed to each day and not any queries
**Update to the screenshot –
add a table filter to get organic only revenue from GA.
To be able to filter Revenue to organic only – you need to add a “Dimension” to the table on the right – click the “+” next to “Add dimension” in the GA data and then “Default Channel Grouping” – you can then create a filter in the report:

Blending Search Console Data in Data Studio
Another common reason to blend data – is to get average position data from Search Console “Site Impression reports, added to “URL Impression” data:
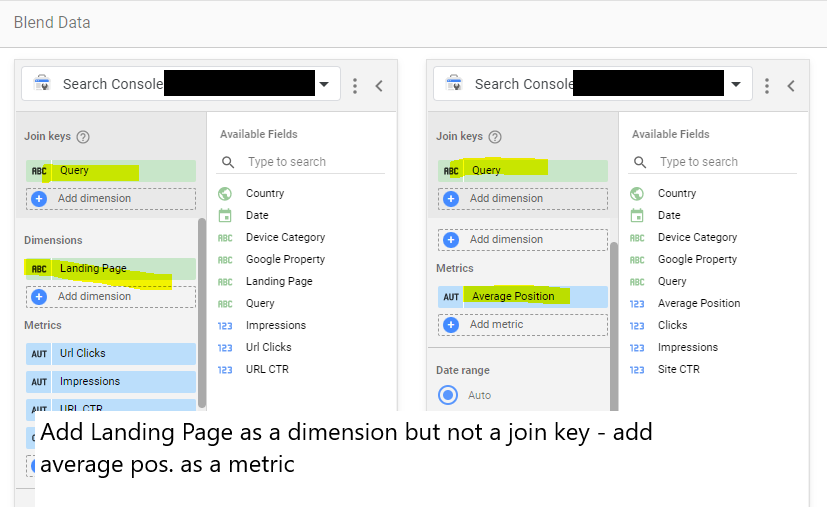
URL impression vs site impression
Incidentally –
the main difference between Data Studio Search Console URL Impression Vs Site Impression data – is that Site Impression contains the Average Position metric and URL Impression contains the Landing Page metric. So when you’re blending the data from both sources, make sure you have “Landing Page” as a metric and “Average Position”.
