Hello, I’m having another go at learning code. I’m an SEO Executive but have been coding quite a few of our SEO-related pages in my day job.
Plan is to do courses on Udemy, then create a blog post about them and do an example. I’ll probably have to do the example on Codepen as I can’t embed code in the free WP blog.
CSS selectors, are used in CSS style sheets to determine what styles to apply to what HTML elements.
In Line CSS (bit chavvy)
You can apply CSS inline – i.e. just add it onto an HTML element
e.g. <H1 style = "margin-bottom 0px;"
CSS in Script Tags
You can add it, somewhere on the HTML doc within <style> </style> tags
<html>
<head>
<style>
  h1 {color:red;}
  p {color:blue;}
</style>
</head>
CSS in an external Style Sheet
Usually the best solution, is to create a separate Style Sheet
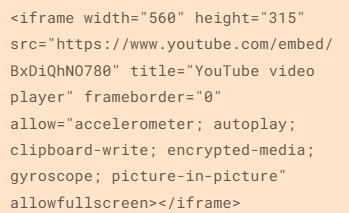
To do this you need a line of code (or markup) linking the HTML doc to the CSS sheet.
For example, if you save and name your stylesheet as styles.css:
Best practice is to put all your styles in a separate stylesheet. Dunno why, just go with it for now.
If you put your CSS in script tags, or in a stylesheet, you’ll need to use Bo selectors.
Imagine you’re a parent.
HTML elements are your kids
The CSS style sheet are the instructions you’re giving to the baby-sitter on how to look after your kids.
Great analogy, I know.
You can be an overprotective, bit of a bellend of a parent and use inline CSS to give you micro-management and control over your kids, but you generally don’t want to do that.
Types of CSS Selectors
ID & Class selectors are the most commonly used. Class selectors for sure. But I’ve listed class selectors second, just to be annoying.
ID selectors
Id selectors use a hashtag, like Twitter but it’s not full of political wankers and Chinese bots – #
Use these selectors sparingly, class selectors usually work better/are preferred.
If you run the codepen below, hopefully you’ll see that I’ve selected only the first ID, and made it blue
ID selectors are specific and therefore override more general selectors
Class Selectors
The most commonly used type of selector
very versatile
Well supported in most browsers – probably all browsers except for like IE 6
You can add multiple classes to an HTML element, so you can style it multiple ways with a class selector
If you run the pen below, you should see the first class coloured pink
Tag Selectors
HTML tags like <h1> and <p> can be targeted directly with tag selectors
Tag selectors are sometimes used to unset styles that browsers set by default
Tag selectors are not so popular. Stick with class selectors if possible.
Just type the name of the tag e.g. H2 and then open curly brackets, add style and close brackets
Attribute Selectors
The value within your HTML tags is called an attribute
You can target them directly with CSS attribute selectors
Positional Selectors
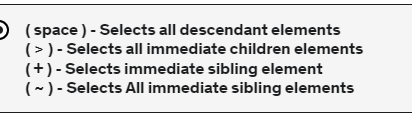
– Decent type of selector when trying to style individual elements of a list or div – To style the second item on a list – prefix the CSS with “li”:
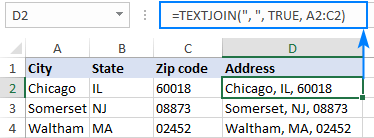
I needed a way of combining a load of commerce product identifier numbers into one cell, separated by columns.
You can download the spreadsheet with the formula here.
Textjoin Formula Example
TEXTJOIN(",",TRUE,F6:F35)
The comma in speech marks, adds the comma between the numbers Not sure what “TRUE” does to be honest! The F6:F35 is just the cells that the original list, that’s aligned vertically in this case, was in.
The code in bold – is for adding a horizontal scroll bar. If a table is too wide on mobile, the scroll bar let’s users slide it across and view all the table’s info and columns
The code in italics – these are “in-house” CSS classes, that probably won’t work or do anything in your code.
Add the number of columns to this bit of code near the top:
<th colspan=”4”
This is how the above code should look when published:
Nobody gives a f*ck about your behind the scenes bollocks, and nobody is googling to find out about the industry award that you won (and paid about 10k to enter).
Create content that’s relevant and of interest to your target audience
Content marketing and inbound marketing is kind of, the new SEO. Google, as we’ve heard a million times, loves great content and great content attracts genuine links.
Create a blog and social media profiles that you’re customers will want to subscribe to – because they’re interesting!
The process is easy, the execution can be a bit of a b@stard to do though.
Identify your target audience
Find out where they hang out online e.g. which Reddit forums and Facebook groups etc
Identify your target audience’s common questions and pain points
Use a tool like SEMRush to ID low competition search terms regarding the questions & pain points
Create useful, in-depth copy/posts that helps your target audience
If resource available, create videos for YouTube based on posts that get most traction
Create short videos suitable for social – with captions!
For blog content, see if you can match the topics you’ve found, with specific keywords, ideally with the highest volume.
Check the search engine results pages (SERPs) and identify any keywords which have “weak” or somewhat irrelevant results.
It’s a bit beyond the scope of this post, but look to optimise your blogs for “rich snippets”, by using lists and html tables.
To check for keywords, you’ll need Keyword Tool like SEMRush to do this, or search “free keyword tool”.
Keep each blog post specific to one or two keywords.
You can also promote your blog posts with outreach, although some content marketing gurus, say you’re better off investing all your time in creating content, rather than promoting it.
For Reddit, you can use this great Reddit Keyword Tool, to identify the most common topics of discussion, in a given forum/subReddit.
The backbone of good content, is that, well, it’s actually good – well written, easy to read, full of visual assets if possible.
When it comes to blog posts, make the content scannable with lists, bullet points and images. If you have the resource, infographics are always a good addition to a blog post.
Statistics are also a great way to attract links and citations from other websites. For example, if you work out the average price of a [given product or service] in the UK, it’s relatively likely to attract links. If you sell UK holiday homes or used campervans, you might work out the average price of new camper van, or the cost per holiday of an overseas holiday versus a holiday home.
Help, Help, Help, Sell
Gary V’s book Jab, Jab, Jab, Right Hook is a bit old now, but the adage of setting up a sale several times, before trying to promote your service or product is still valid, in my opinion.
The “jab” in the book title, is the useful or entertaining content aimed at your target audience
The “right hook” is a blog and/or social media post that aims to sell a product or service.
Would you follow a social account or blog that’s just trying to sell you a service or product?
For example, if an accounting software company has a Facebook account that just promotrs its software directly in every single post, not many people will be interested. However, if the Facebook page posts about tax saving tips, digital marketing for small businesses etc it’s likely to get more engagement.
I’d also avoid lots of
Behind the scenes posts.unless you’re an established brand, nobody gives a shit
Virtue signalling posts
You might follow a brand or company on social media etc, that just promotes itself, if you already know the brand, or if you’re interested in working at the company.
However, unless you’re an established brand, or you create content just for recruitment purposes, then it’s generally best to create blog and social media posts that help, entertain, and/or interest your target audience.
Establish yourself as an authority in your niche, with helpful & insightful content
Drew Griffiths (2022)
It can definitely help to promote discounts and offers on social platforms and blogs, but that’s generally the that’s the “right hook”, whereas the “jab, jab, jab” relates to the helpful, insightful content that should take up about 75% of all your posts.
If you’re in the business to business sector for example, you can gain brand awareness and an online following by providing posts that provide helpful advise on SEO, PPC, Social Media Marketing, Digital Marketing Tools etc. If you’re just trying to directly sell your office chairs, or accounting software in every single blog and social media post, you’re probably not going to get a large, engaged, following.
Don’t Post Links all the Time on Social Media
Social media platforms, from Facebook to LinkedIn, all want to keep users, on their platform. Links will tend to take people onto different websites, and as a result, posting links to your blog etc, will tend to kill your organic reach (the amount of people who see your social media post).
Keto Diet Products Example
If you were running a business selling Keto supplements and foods. You can study the Keto subreddits and Facebook groups, and you’d probably find that there are lots of questions regarding keto desserts.
Jump onto SEMRush, or another SEO Tool and find search terms, and potential headings for blog posts – that have a low level of competition – i.e. it’s relatively easy to rank for.
Create in-depth keto dessert blog content that’s better than what already exists.
Optimise the content for the search terms that you’ve identified on SEMRush.
Reformat the content for social media. Captioned videos tend to do well, as these are the least popular form of content – social media is full of images and text posts, so it’s a bit easier to stand out with a video.
Consider creating a free eBook about keto desserts. Promote the eBook on social media to “warm up” your target audience to your brand* Remarket your products to those that download the eBook.
Create a serious of posts & videos regarding the best keto desserts, the best sweeteners and the best supplements to help with sugar cravings.
*It’s difficult to sell products, particularly high value products to people on Facebook, Instagram etc, as they’re not actively searching for something to buy. Best practice is said to be, create an offer e.g. an eBook, Webinar etc that’s directly of interest (and NOT necessarily directly about your product) and advertise it to your target market on social media – Then remarket to those that engage with your advert.
Hope this blog post helps!
I know the irony about in-depth, long format content that I’m touting in this post, but please bear in mind, I’m writing this on my lunch and I’m not trying to sell anything. Well, unless you want to buy an MMA T-shirt.
The channel covers how to put together powerpoints, how to create videos for your small business and lots of marketing fundamentals for business owners
This is a post to remind me how to add sub-category pages on a specific e-commerce site, but most of the instructions are universal to M1
Go to Catalog – Manage categories
Leave on “All Store Views”
Click into folder you want to put a sub-category
Press “Collapse All” at the top to keep folders tidy
Highlight the Category/Folder you want to add the new sub-category into
Click the “+ Add SubCategory” button (blue)
For a new sport category, click “”NWS UK” and then “+ Add Subcategory”
First Tab – if the H1 is too long for the menu – populate Category Name and Category Heading differently
eg.
First Tab – General Information
– is main tab to fill in – URL Key, meta title, page title (name), meta description
– “Include in Navigation Menu” – “NO”
Second Tab – General
Define Filter menu for left of page “Filter Select Mode” – Enable Selected Filters with the drop down menu
Add “price” as a filter
Add anything else relevant
“Display Settings” Tab
-Products only
Is Anchor – “Yes“
Make a note of ID Number of sub cat.
“Category Products” Tab
Add with product ID or search by name – then tick checkbox on left
Position – uses box on the right. Add in tens – 10, 20, 30, not 1,2,3*
*This makes it easier to add new products in order. If you order everything 1,2,3,4 etc, then you have to change all the order numbers when you add in a new product. Whereas if you order them 10,20,30, then you can add a new product with an order number of 15 and it will sit 2nd.
!Don’t drag the category folders into other folders!
Remember to enable the new Sub-category on the first tab when it’s ready!
Double check – “NO” in “include in menu”
Check added category products – not related products
For personal reference
Remember to keep on “All Store VIews” when adding to es and de too
Thanks to all the external sheets, this has become tricky.
I’ve been using this technique, because I’m an SEO Executive, developing pages for our Magento site, without any dev help – so I’m using existing pages and robbing bits of code to help me layout images properly.
This is for personal reference – so apologies if it doesn’t work for you (let me know)
Right click – Inspect Element
Click the pointer near the top left of the inspect element window – or hover in the code until the area you want to copy is highlighted.
In the elements window, find the element you want to rob the code for and hover over it with the pointer
Move upwards, until the entire section is highlighted – if you move upwards with the pointer and it selects the element/section above, then you’ve gone too far, so move down one
Right click – Copy – Copy Element
Paste into your own code
Note – unlike me (I’m updating the same site as I’m stealing code from) if you are trying to get the code form another website, you’ll need to get the style sheet.
Right click on the webpage and “View source” – then look for:
<link rel=”stylesheet” type=”text/css” href
and click the link after “href” – that should take you to the CSS sheet
Semantic search adds context and meaning to search results. For example, if someone is searching for “Lego” – do they want to buy Lego toys, or see a Lego movie or TV show (Ninjago is great). Another example might be “Tesla” – do people want to see the latest self-driving car, or learn more about Tesla the scientist and inventor?
How to Optimise for Semantic Search
Make sure you understand search intent and any confusing searches like Tesla(inventor or car?), Jaguar (car or animal?), etc
Look for structured data opportunities
Optimise internal links – especially if you are using a “Pillar Post” and “Cluster Page” structure
Follow traditional on page SEO best practices with headers, meta titles, alt tags etc
Tools for Semantic Search
SMA Marketing have done a cool YouTube video about Semantic Search and they recommend tools including:
Wordlift
Frase
Advanced Custom Fields for WordPress
Google Colab with a SpaCy
Before you publish a post – look at the search results for the keyword(s) you are optimising the post for. Check in incognito in Chrome to remove most of the personalisation of the results.
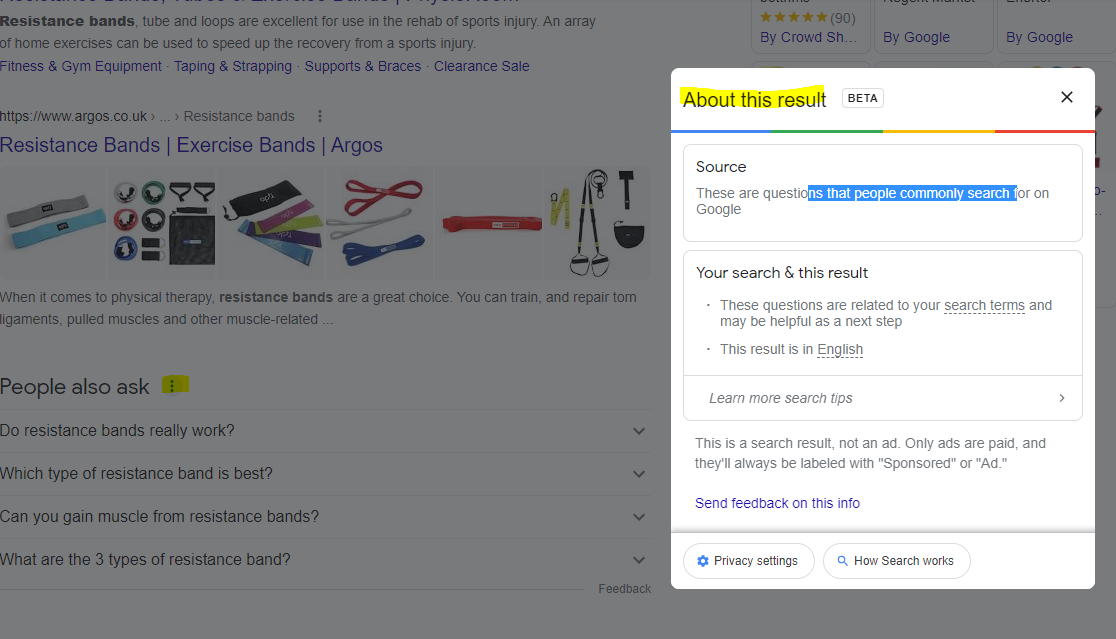
For any answer boxes or snippets, you can click the “3 dots” to get information about the results:
As well as the snippets, you can click the 3 dots next to any organic result. Here’s another result for “MMA training program pdf” with some additional information:
With this in mind – if you are looking to rank for “MMA training program pdf” then you will want to include the search terms highlighted in the “About this result” box: mma, training, program, pdf and ideally LSI keywords “workout” and “plan”.
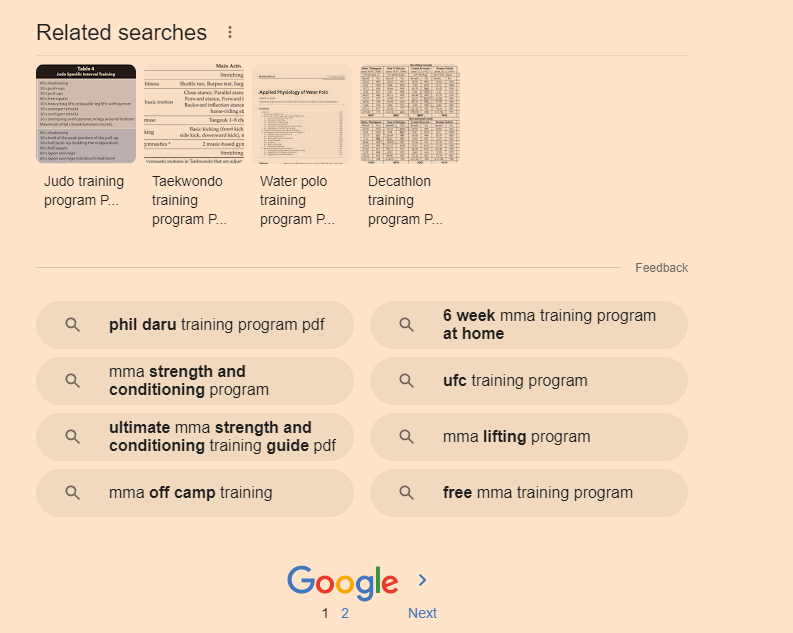
It’s also a good idea to scroll down to the bottom of the SERP and check out the “related searches”
Take a look too at any breadcrumb results that pull through below the organic listings. Combining all this information will give you a good idea as to what Google understands by your search query and what people are looking for too.
Hover over [1] and click the play icon that appears (highlighted yellow in screenshot below)
When that section has finished loading and refreshing, scroll down to the “Installation tensorflow + transformers + pipelines” section and click the play icon there.
When that’s finished doing it’s thing, scroll down again, and add your search query to the uQuery_1: section:
add your query and then press the “play” button on the left hand side opposite the uQuery_1 line
You should then see the top 10 organic results from Google on the left hand side – in the form of a list of URLs
Next, you can scrape all the results by scrolling down to the “Scraping results with Trafilatura” section and hover over the “[ ]” and press play again:
Next, when the scraping of results is done – scroll down to “Analyze terms from the corpus of results” section and click the play button that appears when you hover over “[ ]”
Next! when that’s done click the play button on the section full of code starting with:
“df_1[‘top_result’] = [‘Top 3’ if x <= 3 else ‘Positions 4 – 10’ for x in df_1[‘position’]] # add top_result = True when position <=3 “
Finally – scroll down and click the play button on the left of the “Visualizing the Top Results” section.
On the right hand side where it says “Top Top 3” and lists a load of keywords/terms – these are frequent and meaningful (apparently) terms used in the top 3 results for your search term.
Below that, you can see the terms used in the results from 4-10
Terms at the top of the graph are used frequently in the top 3 results e.g. “Mini bands”
Terms on the right are used frequently by the results in positions 4-10
From the graph above, I can see that for the search term “resistance bands” the top 3 results are using some terms, not used by 4-10 – including “Mini bands”, “superbands” “pick bodylastics”
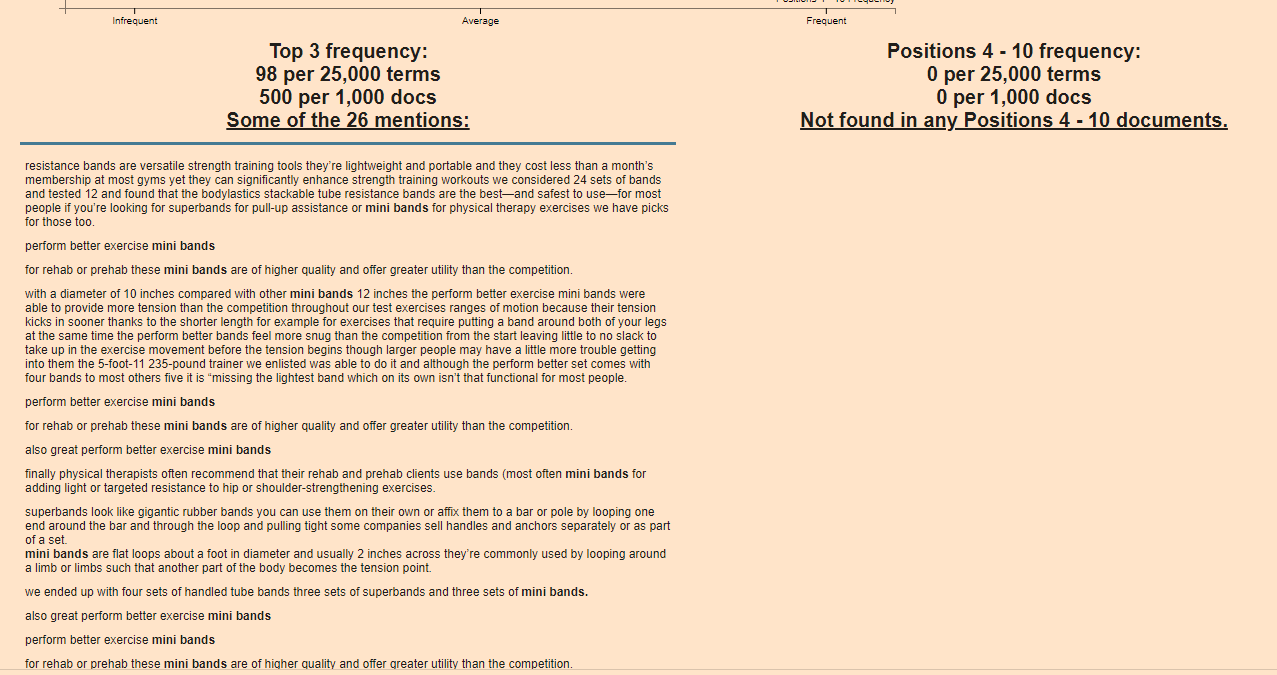
If you click on a term/keyword in the graph – a ton of information appears just below:
e.g. if I click “mini bands”
It’s interesting that “mini bands” is not featured at all in the results positioned 4-10
If you were currently ranking in position 7 for example, you’d probably want to look at adding “mini bands” into your post or product page
You can now go to the left-side-bar and click “Top 25 Terms” and click the “play icon” to refresh the data:
Obviously – use your experience etc and take the results with a pinch of salt – some won’t be relevant.
Natural Language Processing
next click on “Natural Langauge Processing” in the side-menu
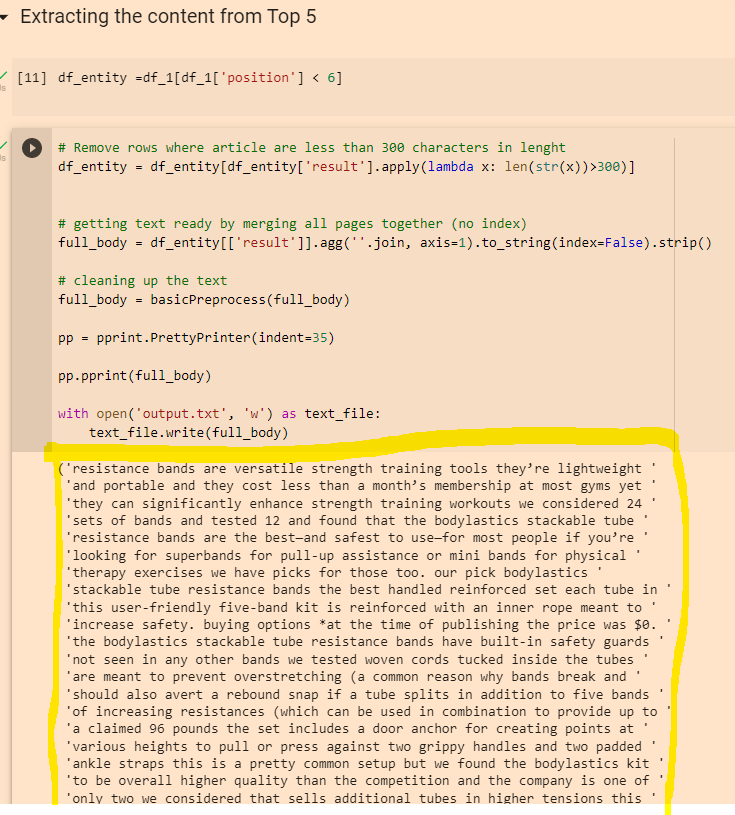
Click the “play” icons next to “df_entity =df_1[df_1[‘position’] < 6]” and the section below.
When they have finished running click the play icon next to “Extracting Entities”
Click “play” on the “remove duplicates” section and again on the “Visualising Data” section
This should present you with a colourful table, with more terms and keywords – although for me most of the terms weren’t relevant in this instance 😦
You can also copy the output from the “Extracting the content from Top 5” section:
Then paste it into the DEMO/API for NLP that Google have created here:
You can then click the different tabs/headings and get some cool insights
Remember to scroll right down to the bottom, as you’ll find some additional insights about important terms and their relevance
The Google NLP API is pretty interesting. You can also copy and paste your existing page copy into it, and see what Google categories different terms as, and how “salient” or important/relevant it thinks each term is. For some reason, it thinks “band” is an organisation in the above screenshot. You can look to improve the interpretations by adding relevant contextual copy around the term on the page, by using schema and internal links.