Keyword gap – add competitors, see what they are ranking for, that you are not.
Filter by search volume of keywords and keyword difficulty.
Keyword gap is also good for Google ads insights. If a keyword is les than a few dollars per click, but is transactional and difficult to rank for organically, it might be worth bidding on in Google ads.
On Page SEO Checker
Gives you ideas including top pages to optimize.
suggests keywords to include on specific pages
suggests backlinks to go after
UX issues can be flagged here too – connect Google analytics. Check out pages with high bounce rate and short time on site.
Organic Traffic insights
Connect Google analytics and search console
Here, you can see pages with good and bad UX metrics and the keywords driving traffic
You can also see which keywords each page ranks for.
Use this report to decide if you should include other keywords on a given page – in the page’s existing content, or create new, more specific pages.
Domain overview
Key metrics, shown at the top include bounce rate and average time on site.
You can see your own, or competitors top pages in terms of traffic
See traffic sources- what percentage of traffic is direct, coming from social media etc. (you may have to click on “Traffic Analytics” in the side menu to see this)
You can compare domain metrics to another competitors, or your own website.
You can use Bulk Analysis to enter up to 100 domains to examine.
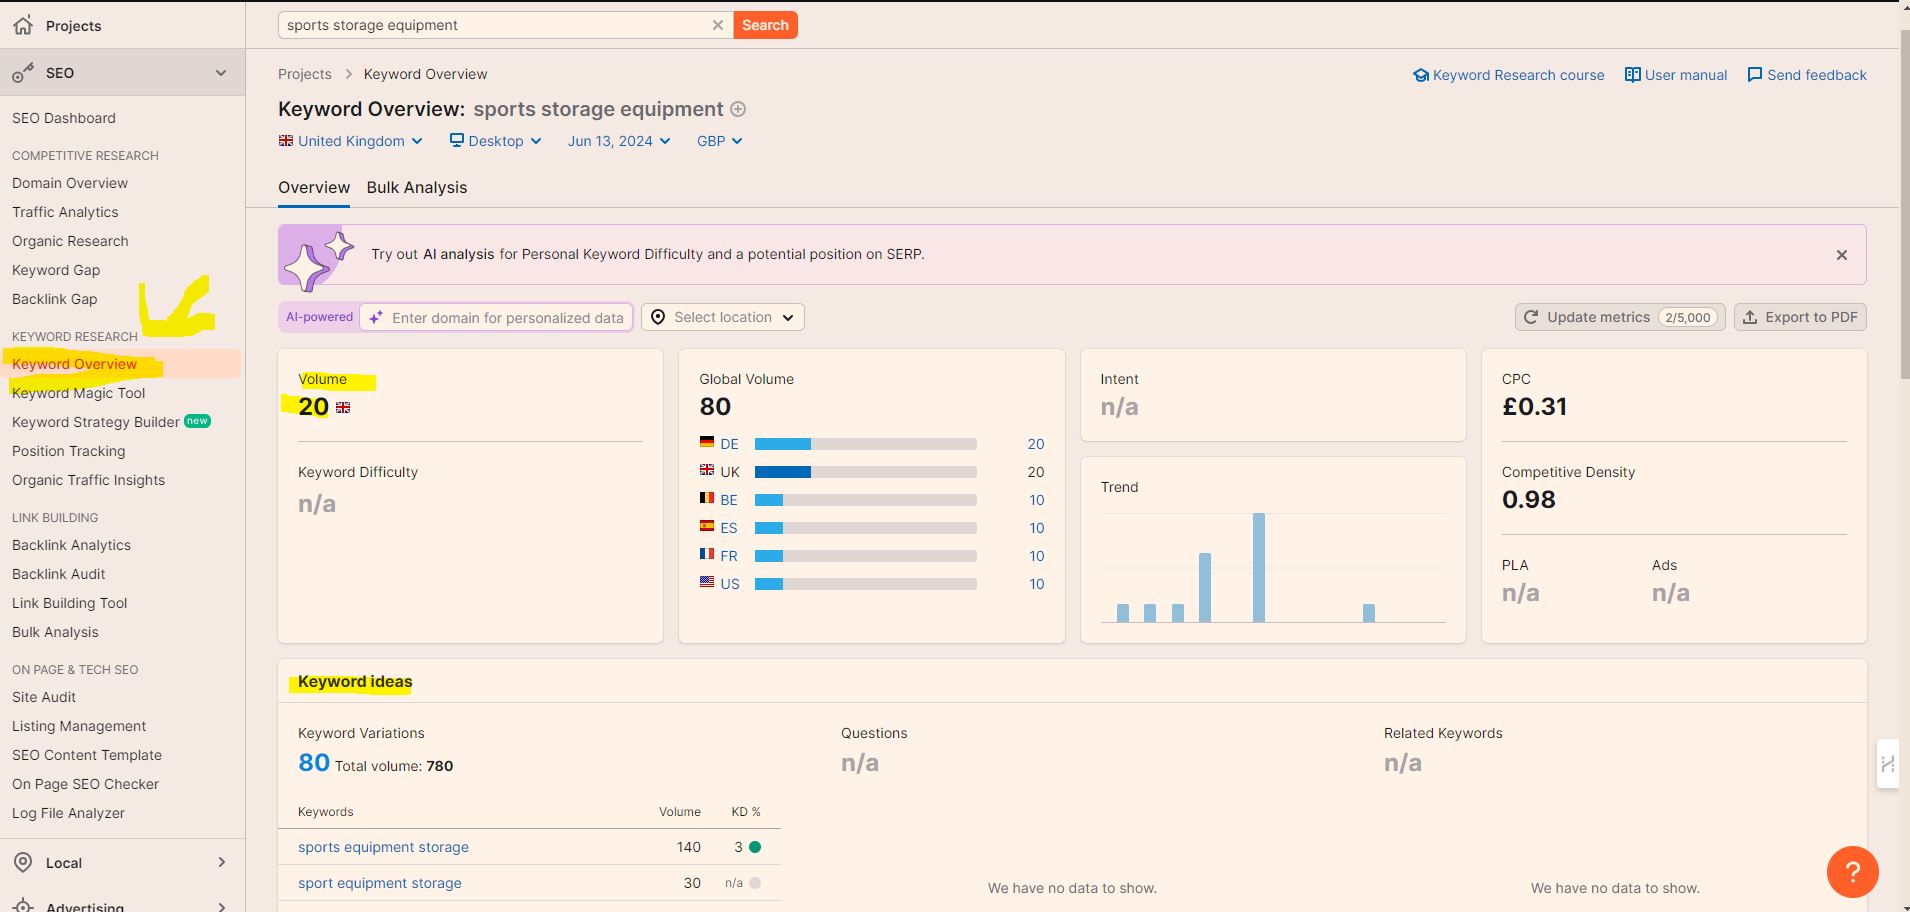
Keyword overview tool
Good for finding head/seed keywords.
Can view the Google SERPs and see what the competition for a given keyword is like
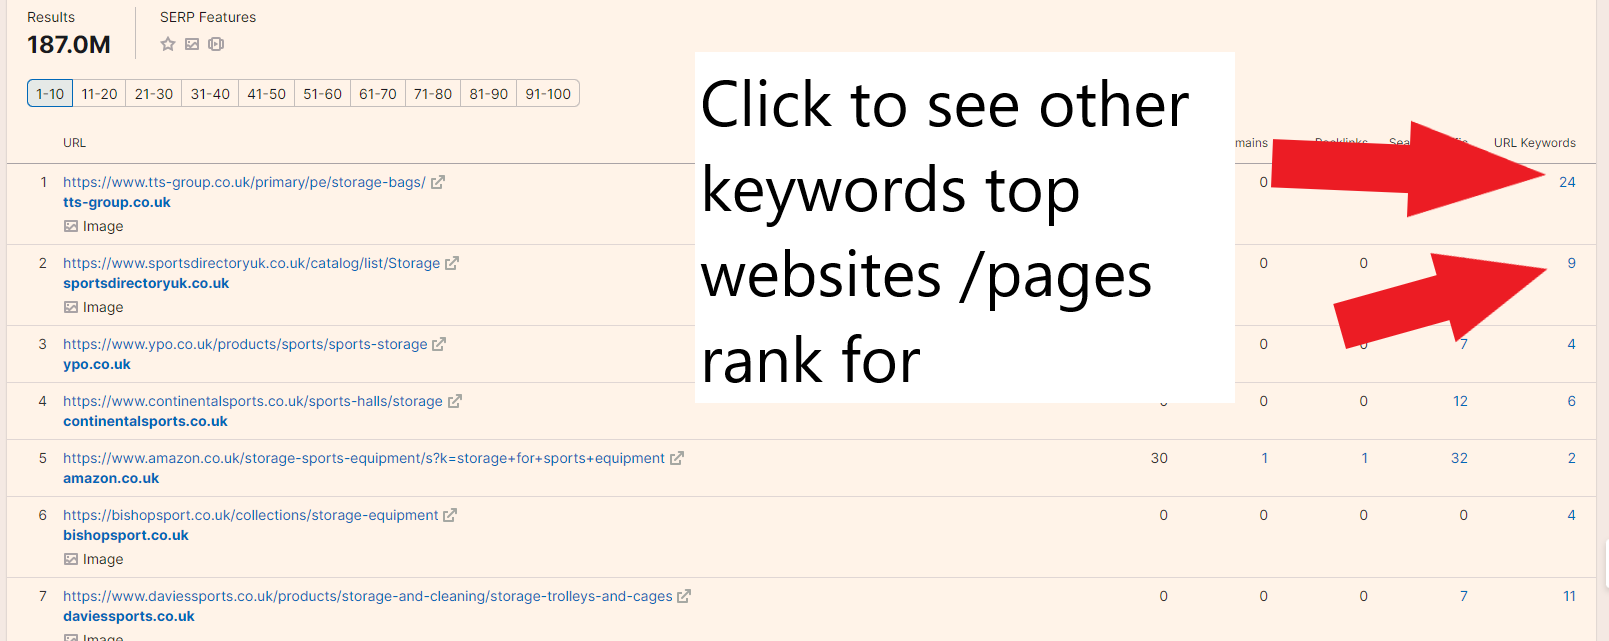
See what other keywords competitors are ranking for, on a given URL:
You can see questions related to/containing a given keyword
You can see international search volume for a keyword.
Related keywords are shown too – e.g. “football supplies” is related to “football equipment”
See SERP Features – what rich snippets etc are showing in the SERPs.
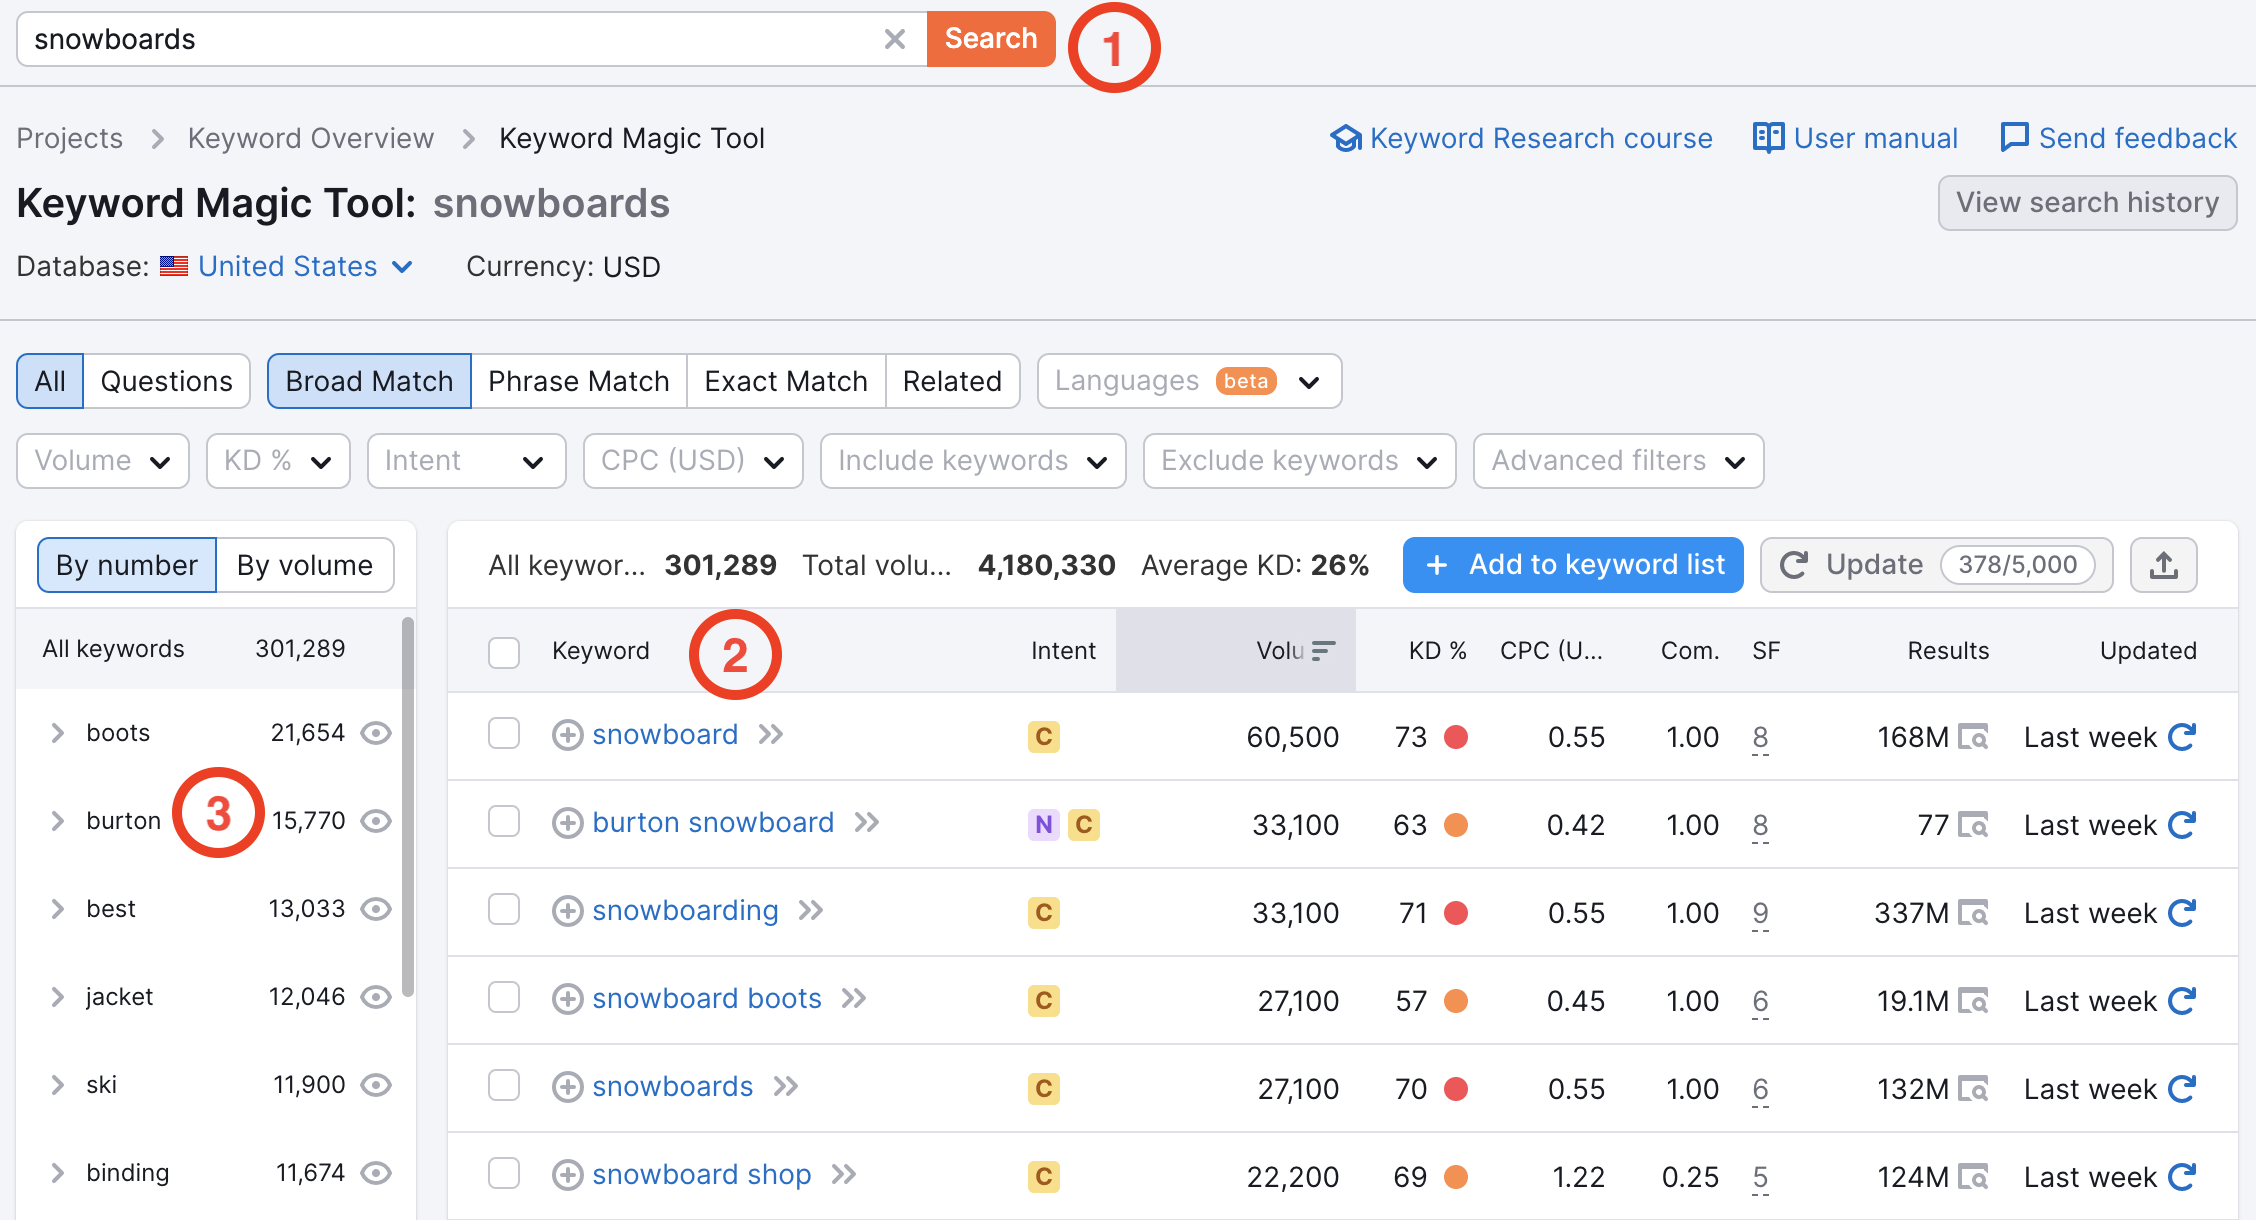
Keyword Magic tool
Start with a seed keyword
by default the report will give you broad match keywords.
Be sure to check out “related” match types (all keywords is also helpful)
For KW research – click on one of the main head KWs – and see what keywords your competitors rank for (clicking on the keyword takes you to the Keyword Overview tool – scroll down to SERP Analysis)
For example, if you enter “football equipment” (in the US) the tool gives lots of article ideas around “shoulder pads”, “football helmets”, “football cleats” etc.
Sometimes you get random ideas that you would never have thought of, like the searches around the dog called “pickle” when you look for topic ideas about Pickleball
There is loads more you can do with SEMRush, including position tracking. I’ll cover these additional tools in dedicated blog posts.
Keyword Manager
If you have a big list of keywords you want to get search volume for, I like to click “create a regular list” and then name the list and click “Add keywords” in the top right of the screen
Also handy if you’ve done keyword research for one country and need the search volumes for another country
You can view code in Chrome, by right-clicking on a webpage and clicking “view page source”
You can see the code of the page, but you can’t do much with it.
Instead, you can right click and choose “developer tools”
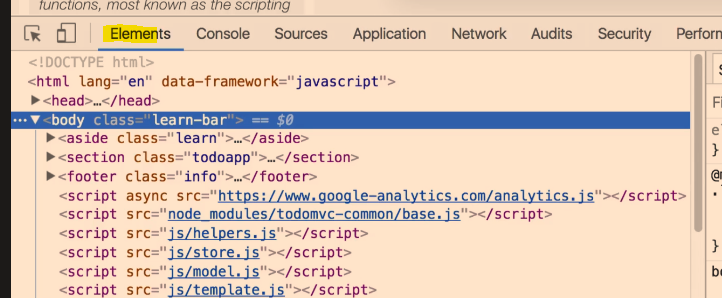
The elements panel is normally the default panel that you see:
As you hover over items in the Elements tab, it will highlight the relevant part of the webpage too.
You can right-click and choose “Inspect Element” and the Dev Tools window will open up, with the relevant piece of HTML code highlighted. For example, if you click the main header of a page, and choose “Inspect Element”, there’s a good chance you’ll be taken to the elements tab and have a “<h1>” highlighted.
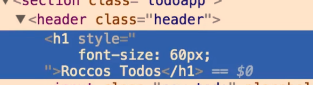
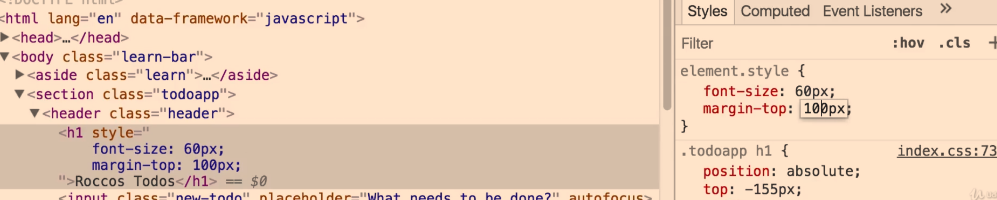
You can change the text if you like, and the style – by typing and editing it in the styles panel on the right:
You can click the “+” symbol to add a new style (I couldn’t be arsed putting this screen snippet into Paint to used proper type-text):
You can right click > Inspect an element and click the delete key to get rid of a style
Click on the colour picker to get a eye-dropped tool and other colour-picker options to change colours used on the webpage:
Chrome Developer Tools
Click the mobile icon – to see a website previewed on a mobile phone – you can change the phone model with the drop down menu
Console Tab
You can type console.log javascript code. This allows you to see the output of JavaScript code.
Web developers log messages for 2 general reasons:
Making sure that code is executing in the right order.
Inspecting the values of variables at a certain moment in time.
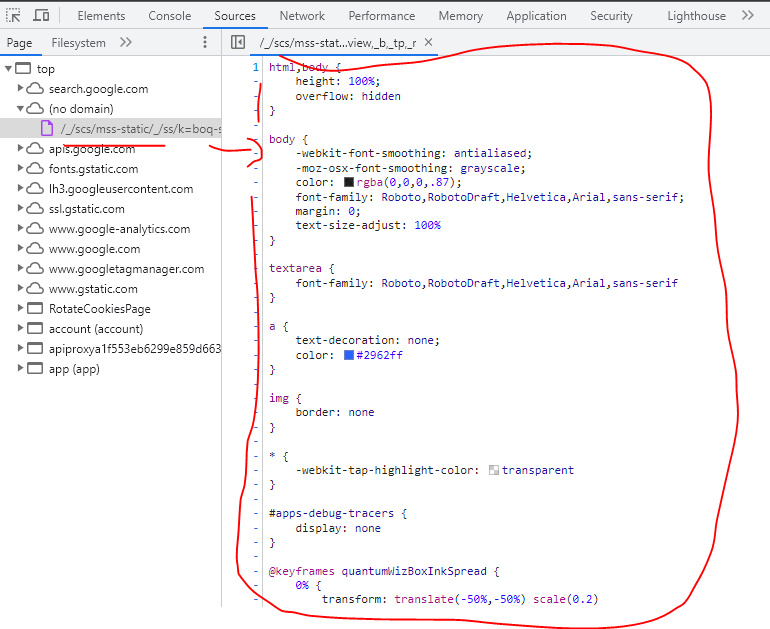
Files and folders that have been loaded by the webpage, can be found in the Sources tab – e.g. type Jquery to see if a page is using jquery
It’s often used for debugging JavaScript:
“Top” – The top-level, such as top on the screenshot above, represents an HTML frame. You’ll find top on every page that you visit. top represents the main document frame. (more info here)
The second-level, such as developers.google.com on the screenshot above, represents an origin.
The third-level, fourth-level, and so on, represent directories and resources that were loaded from that origin. For example, on the screenshot above, the full path to the resource devsite-googler-button is developers.google.com/_static/19aa27122b/css/devsite-googler-button.
You can click individual files to view them in the preview pane in the middle:
Edit CSS and JavaScript
You can edit code and see the changes immediately on the webpage
CSS changes take effect immediately, no save needed. For JavaScript changes to take effect, press Command+S (Mac) or Control+S (Windows, Linux). DevTools doesn’t re-run a script, so the only JavaScript changes that take effect are those that you make inside of functions.
You can save snippets of code and run them on any page
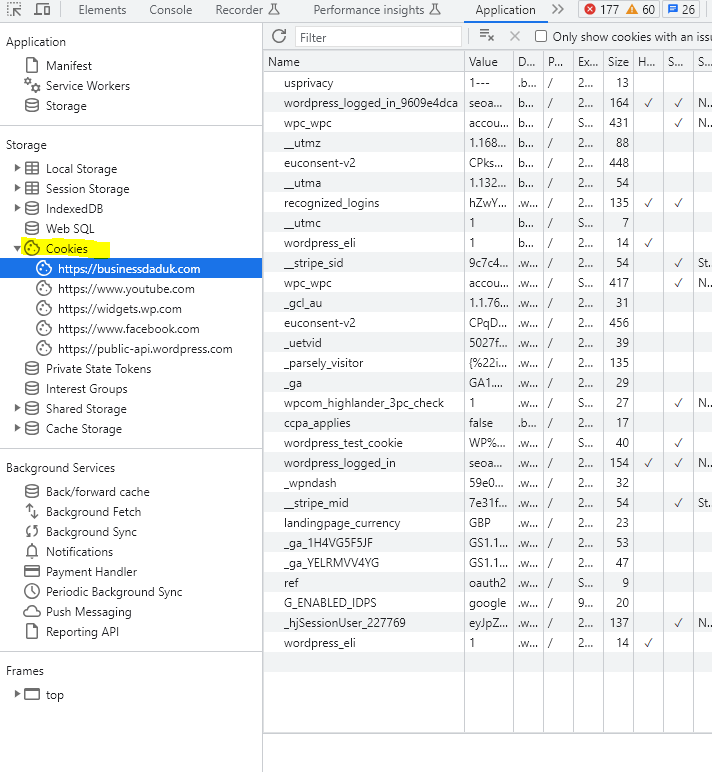
Application Tab
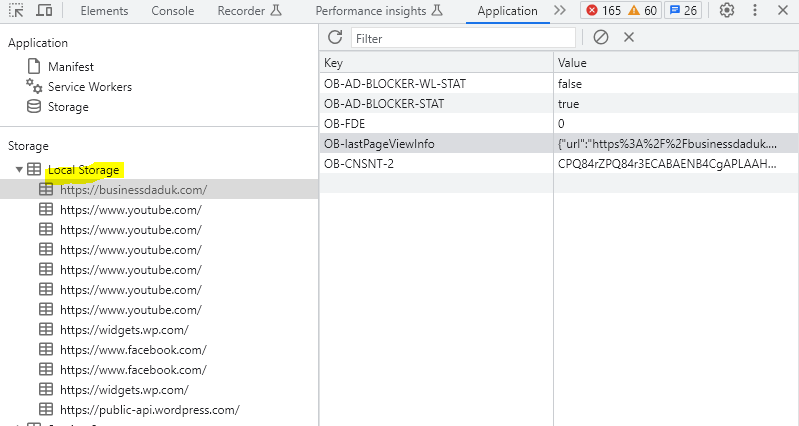
See local storage – Open the local storage section – you can see, well the local storage:
I have no fucking idea what any of this stuff means at the time of writing. I think the {“url” etc is some type of JSON
The DOM – can be seen in the Elements Tab of Inspect-Element, allows you to:
Review various content elements includng meta title
Verify if Google can crawl it
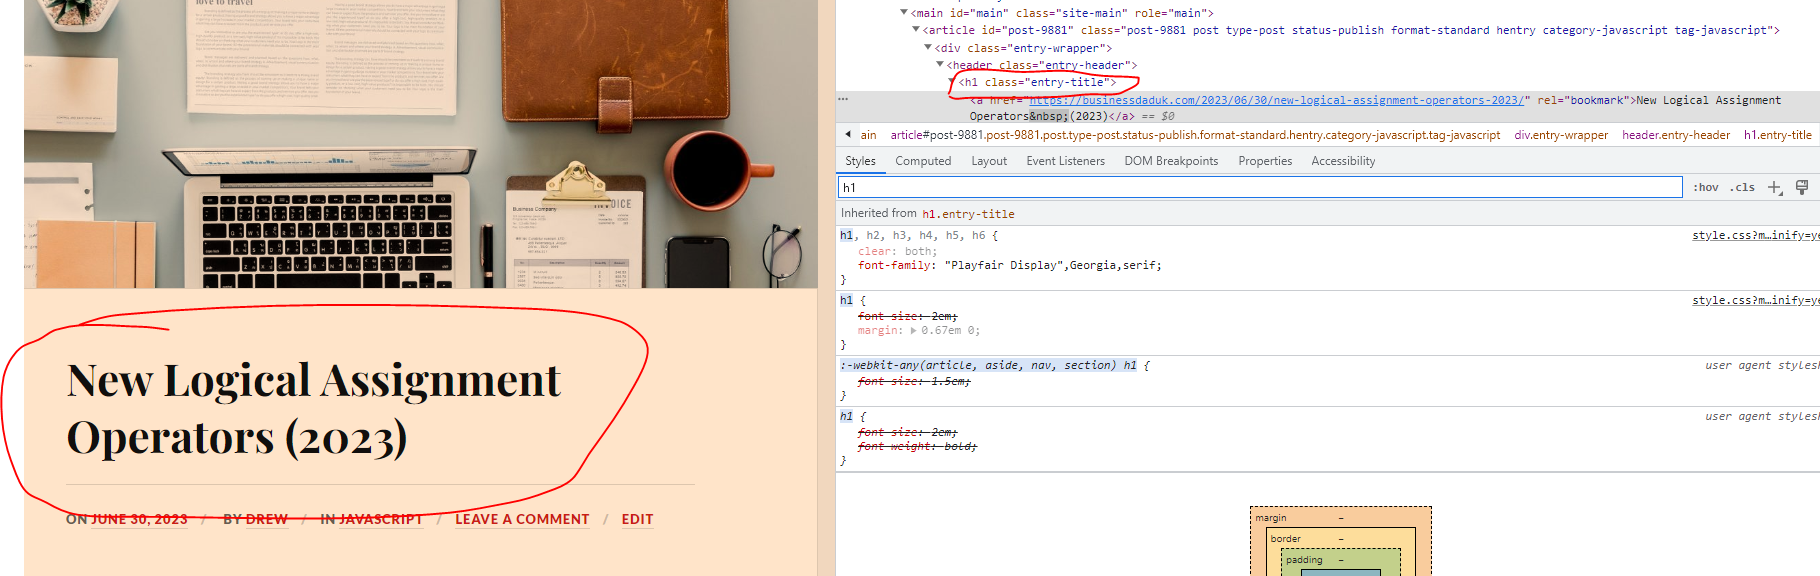
A key thing to look for here is the differences between source-code and the contents of the elements tab.
Fucking JavaScript When auditing websites that have heavy JavaScript usage, content – such as page headers – sometimes appears fine in the HTML source code. But if injected via JavaScript, it may just show as a JS block in the Elements tab.
This can potentially be an issue, later verified through performing a site:example.com/page “content you’re looking for” advanced search and checking the cached version of the page.
The blog heading here, appears to be fine and stuff:
2. Check on mobile devices
Use the mobile icon on the top menu-bar, next to the “elements | Console” tab options, to see the page in different mobile devices
3. Site Speed
This can really be useful if you’ve blocked your staging website and 3rd party tools can’t access your URL
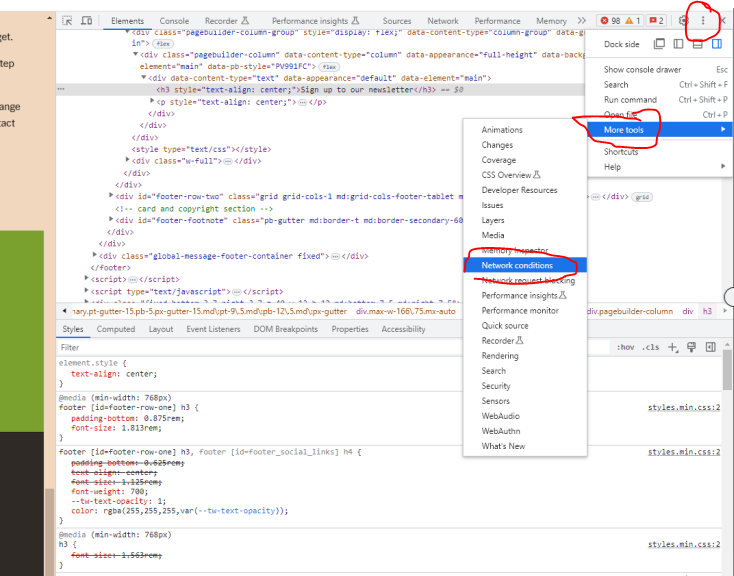
From the three-dot burger menu in the top right of the screen, you can access Network Conditions (found under More Tools).
you can throttle the network to slow 3G etc
Disable broswer cache
You can also select from a number of user agents ranging from Googlebot Smartphone through to various Microsoft Edge UAs, and Opera.
Once you have setup the setting for the network – go to the NetWork Tab, and see the page load
4. Render Blocking Resources
As mentioned previously, from the Network tab you can identify which JavaScript and CSS resources are being loaded before the DOM.
While this isn’t necessarily an issue on all websites, having resources load ahead of the DOM can potentially lead to it being blocked, which is one of the more common and resolvable site speed issues.
These can be identified by filtering for JS and CSS in the Network tab:
You can also see which elements, JS, CSS etc have a 200 status code, and which 404 or are blocked
In order to switch your user-agent in Chrome, use the Network Conditions tab in the console drawer.
Sometimes security measures on a website might stop Googlebot from crawling
Using the User-Ageny tool in dev tools, it’s possible to see if bots are getting blocked
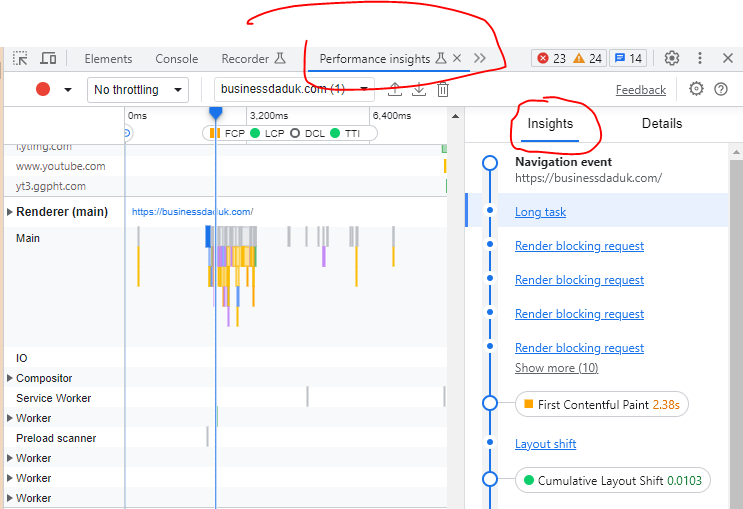
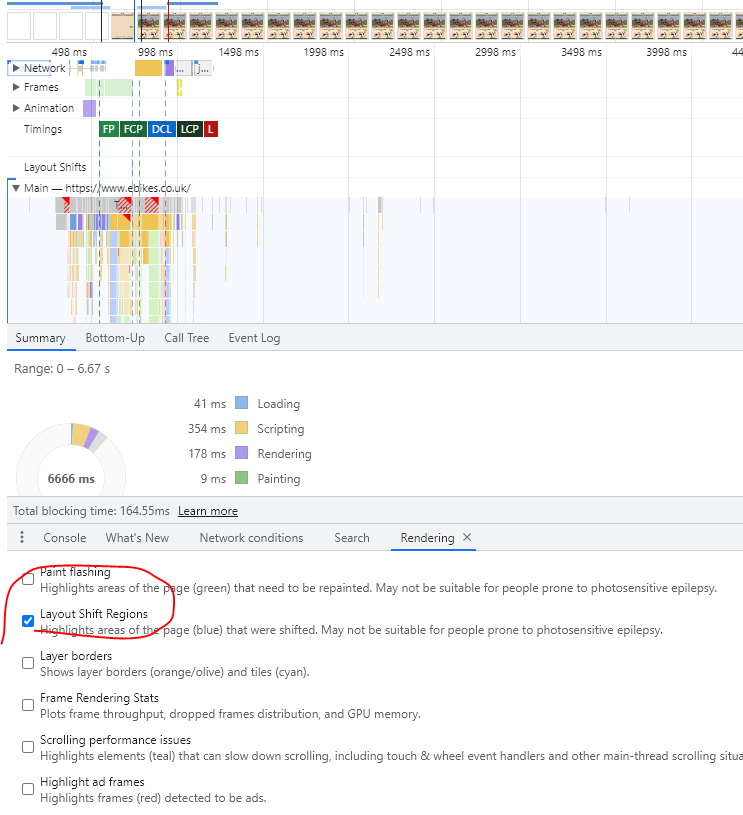
Diagnosing Core Web Vitals in DevTools
Within the timings section, users can see flags for things like FCP (First Contentful Paint), and LCP (Largest Contentful Paint), one of our Core Web Vitals.
In hovering over the flag for LCP, we can actually see the piece of content flagged to be the largest contentful paint during the page load.
In order to help detect layout shift, use the Rendering tab in the console drawer:
Check the option for Layout Shift Regions, which will highlight areas of the page that undergo a layout shift as content is loaded. (when you go back to the performance tab and refresh)
Layout shifts will then be highlighted in blue as you interact with the page.
3. Double-Check Your HTTP Headers & Review Unused Code
After selecting a resource, the Headers sub-menu in the Network tab allows us to see a host of information regarding the selected file. (headers appears when you click and choose a file)
This includes all HTTP header information, like the Request URL, the Request Method, the Status Code, content-encoding, last-modified date, server, and so much more.
You can lean on this info to:
Verify GZip compression is enabled.
Double-check that cache-control is working as expected.
Verify we’re sending Googlebot and other user-agents the appropriate status code.
View the DOM in the Elements panel, to make sure Google can see it
Use this to review the content of any of the page’s elements (such as the title, meta description or page text) to verify that the desired relevant information is shown in each case, to make sure it’s accessible to Google.
When identifying these differences between the content shown in both, you can then take the appropriate steps to verify it’s being indexed correctly: reviewing the page cached version in Google, verifying if the text is being shown in Google’s results when searching for it, using the “Fetch as Googlebot” in Google Search Console and so on.
3. Find Unused JavaScript & CSS
To look for unused JavaScript & CSS open the Chrome Web Devtools, go to elements and press ctrl+shift+P and type coverage; and then select [Show Coverage]
After selecting show coverage you will see the below screen, now you have to click on reload button as you can see in the screenshot and that will finally lead you to the coverage report that will show you the JS & CSS files.
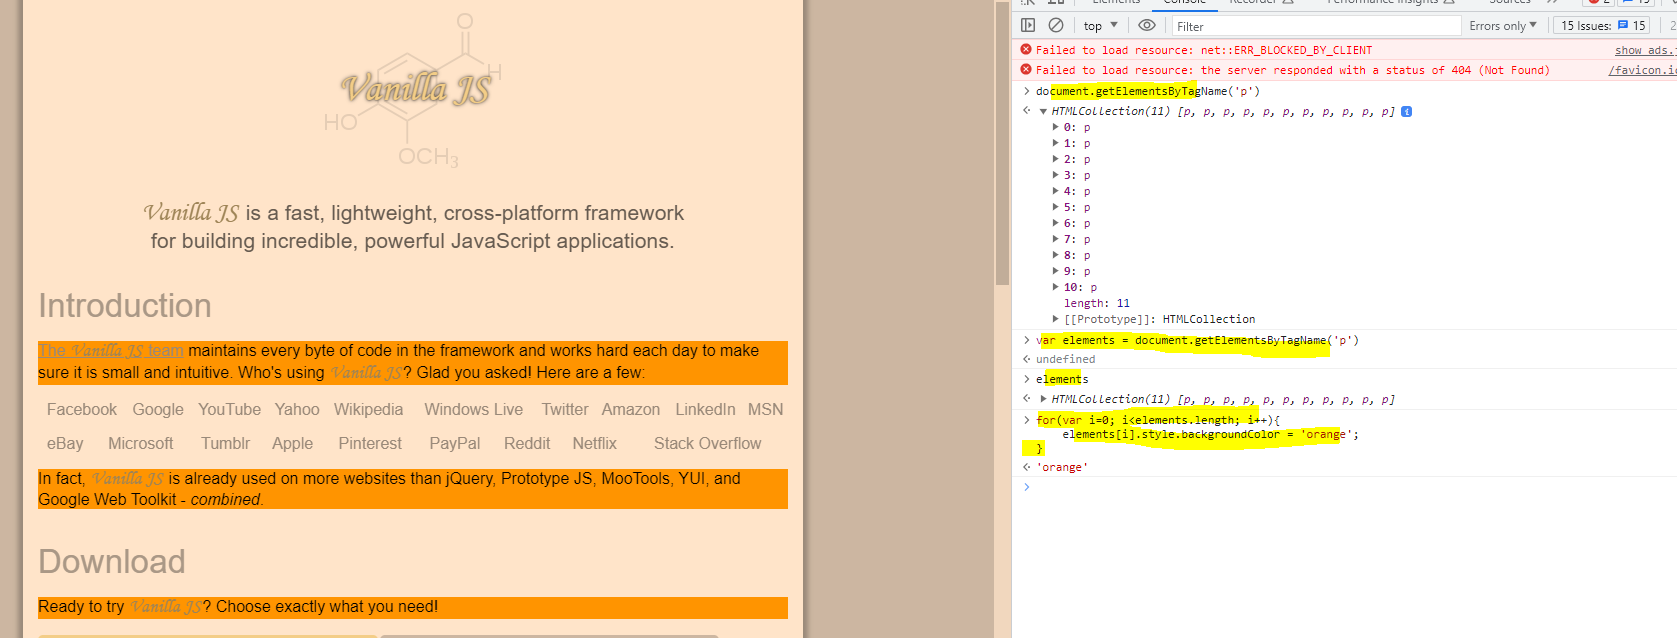
You can do a few nifty things, that seem a bit pointless at this point, like for example, calling and seeing how many paragraph <p> tags are on a page:
There are 5 paragraph tags, in the example shown above^
You can change the background colour of elements, like paragraphs:
Put the elements in a variable, and then change them with a loop^
Here i’ve changed the background colour of the paragraphs on vanilla-js.com:
Sources Tab & Basic Debugging
Right click on an element and select “inspect”
Go to the sources tab
You can click on lines of code to create a “breakpoint” so the code stops on that particular line of code
Breakpoints – pauses the code at a specific point
More info on setting up breakpoint to pause code in the Google documentation here
Line-of-code breakpoints
Use a line-of-code breakpoint when you know the exact region of code that you need to investigate. DevTools always pauses before this line of code is executed.
To set a line-of-code breakpoint in DevTools:
Click the Sources tab.
Open the file containing the line of code you want to break on.
Go to the line of code.
To the left of the line of code is the line number column. Click on it. A blue icon appears on top of the line number column.
You can view the local and global scope of the code
The “Filesystem” panel, tells you all the files that make up the current page:
Official Google Documentation for Chrome Dev Tools
Google has their own info and tutorial stuff on dev tools here.
Elements tab – we can see HTML representation of DOM – check page elements are in the DOM
Network tab – see what happens between the server and our browser. Reload page – and see each request from the server and the response You can see where time is spent. We can see each element/request – we can see how long it took including the time the server and download took. We can also see http/response headers – make sure there’s no X-robots tags if you want it indexed You can click on an element/request, then click on “initiator” and see what requested it:
Network tab can also be used to disable the cache, set network speed and the user agent.
Please note that Googlebot might not always work as expected, real Googlebot will respect robots.txt and some sites might do IP lookups to see if a request is really from a data centre.
Some SEO Checks using Developer Tools:
Dev Tools Checks
Inspect main elements – are they visible in the inspect window? e.g. right click and inspect the Headings – check <head> has meta title and desc
Check on mobile devices
Check all the elements result in a 200 – view the Network tab
Network Tab – Check with Googlebot
Console tab – refresh page – what issues are flagged?
Unused JS in the elements tab – coverage
Check for client rendered links using the code above , using the console tab
You can also use a “diff tool” to check the difference between a live DOM copied from dev tools and the view source code.
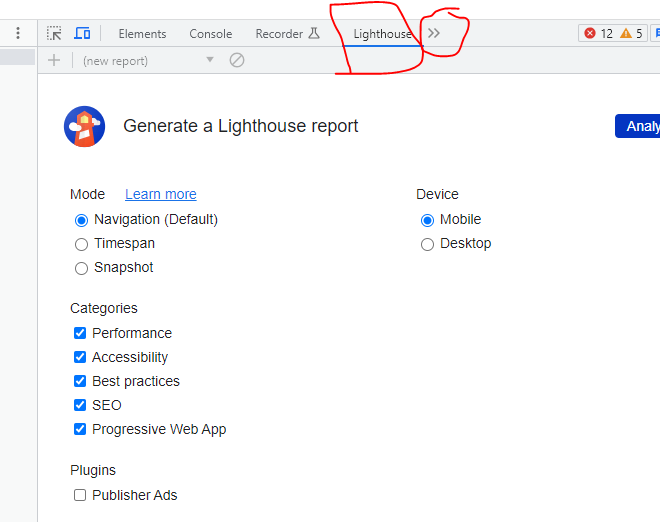
In the menu with the two arrows >> – you can click that and it has an option to analyze the DOM – which then gives you the number of elements and a few other bits
Just click the arrows, and then “Analyze DOM Size” and click the play icon
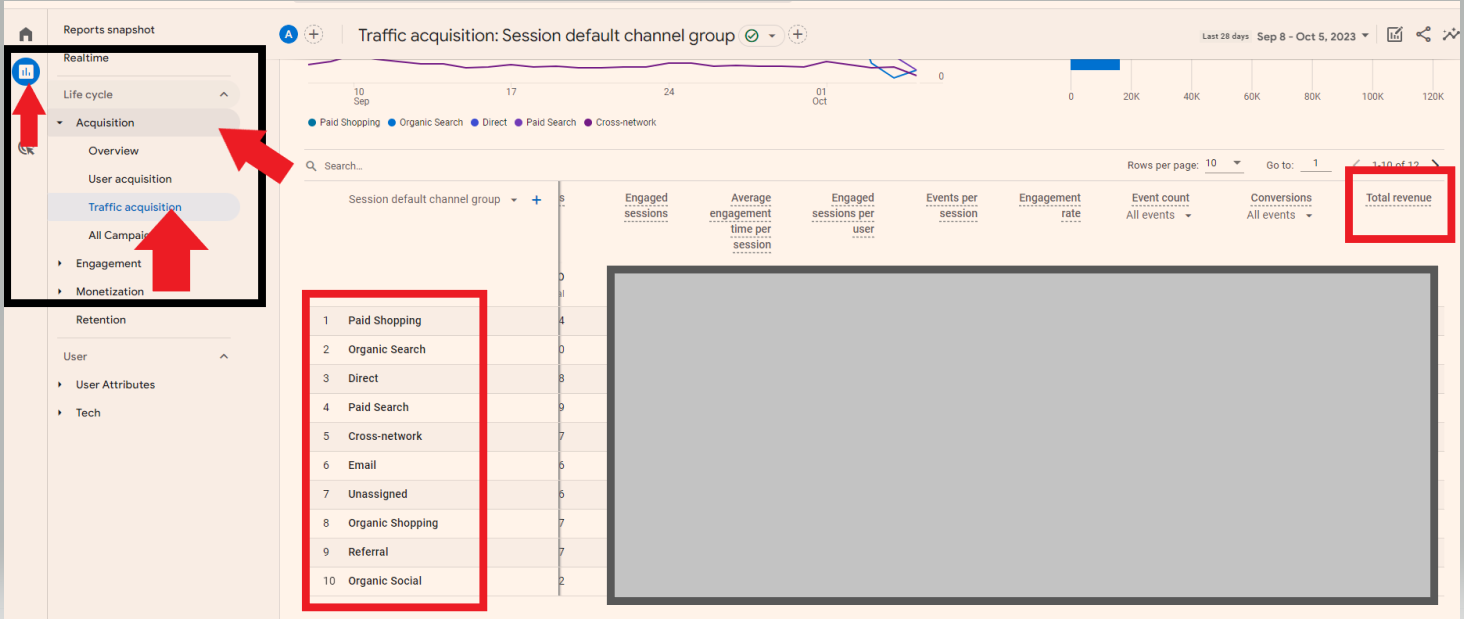
Reports – Acquisition – Traffic Acquisition – see channels and revenue – Scroll right to see revenue column in table:
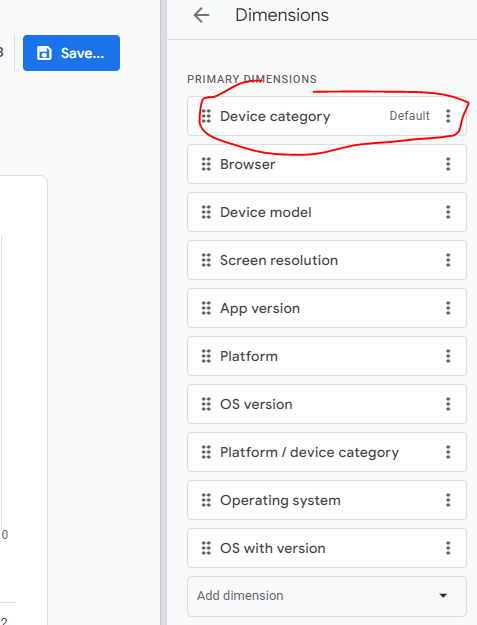
Useful Report 2 – Browser & Device
Reports – User – Tech – Tech details – Add filter for Device:
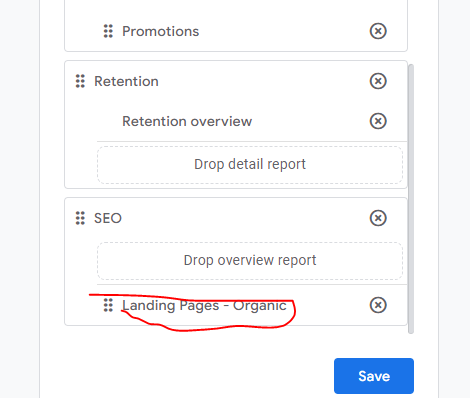
Useful Report 3 – Organic Landing Page Report in GA 4:
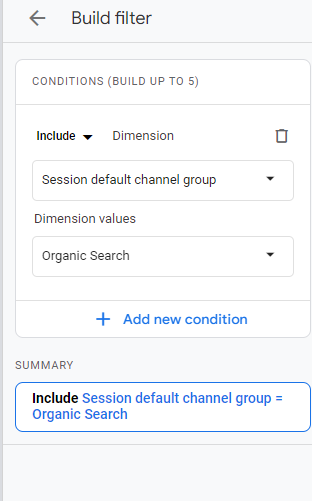
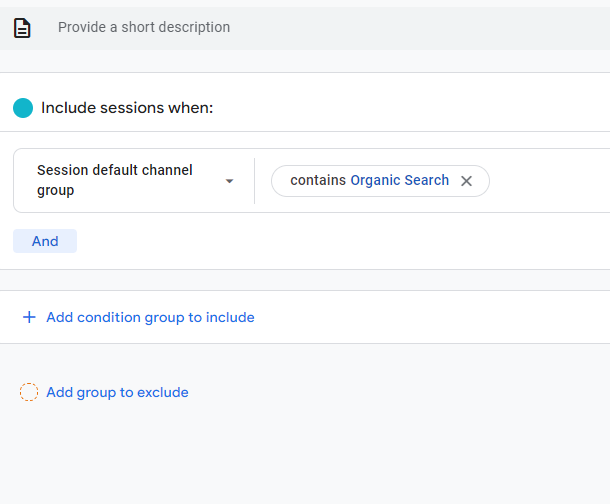
Reports – Acquisition – Engagement – Pages and screens – Add a filter by clicking top right “+” button Search for “session” and choose session default channel group – exactly matches – Organic search:
Reports – Life Cycle – Engagement – Pages and SCreens:
GA4 uses events for bloody everything.
You’ll need to set up one type of events – conversions, whilst others are set up for you.
Benefits of GA 4 Include:
You can track across app and website
Visualise buyer journeys easier
Easier to customise reports
BigQuery Exports
You can ask questions and get quick answers (in the search box at the top)
Things to note:
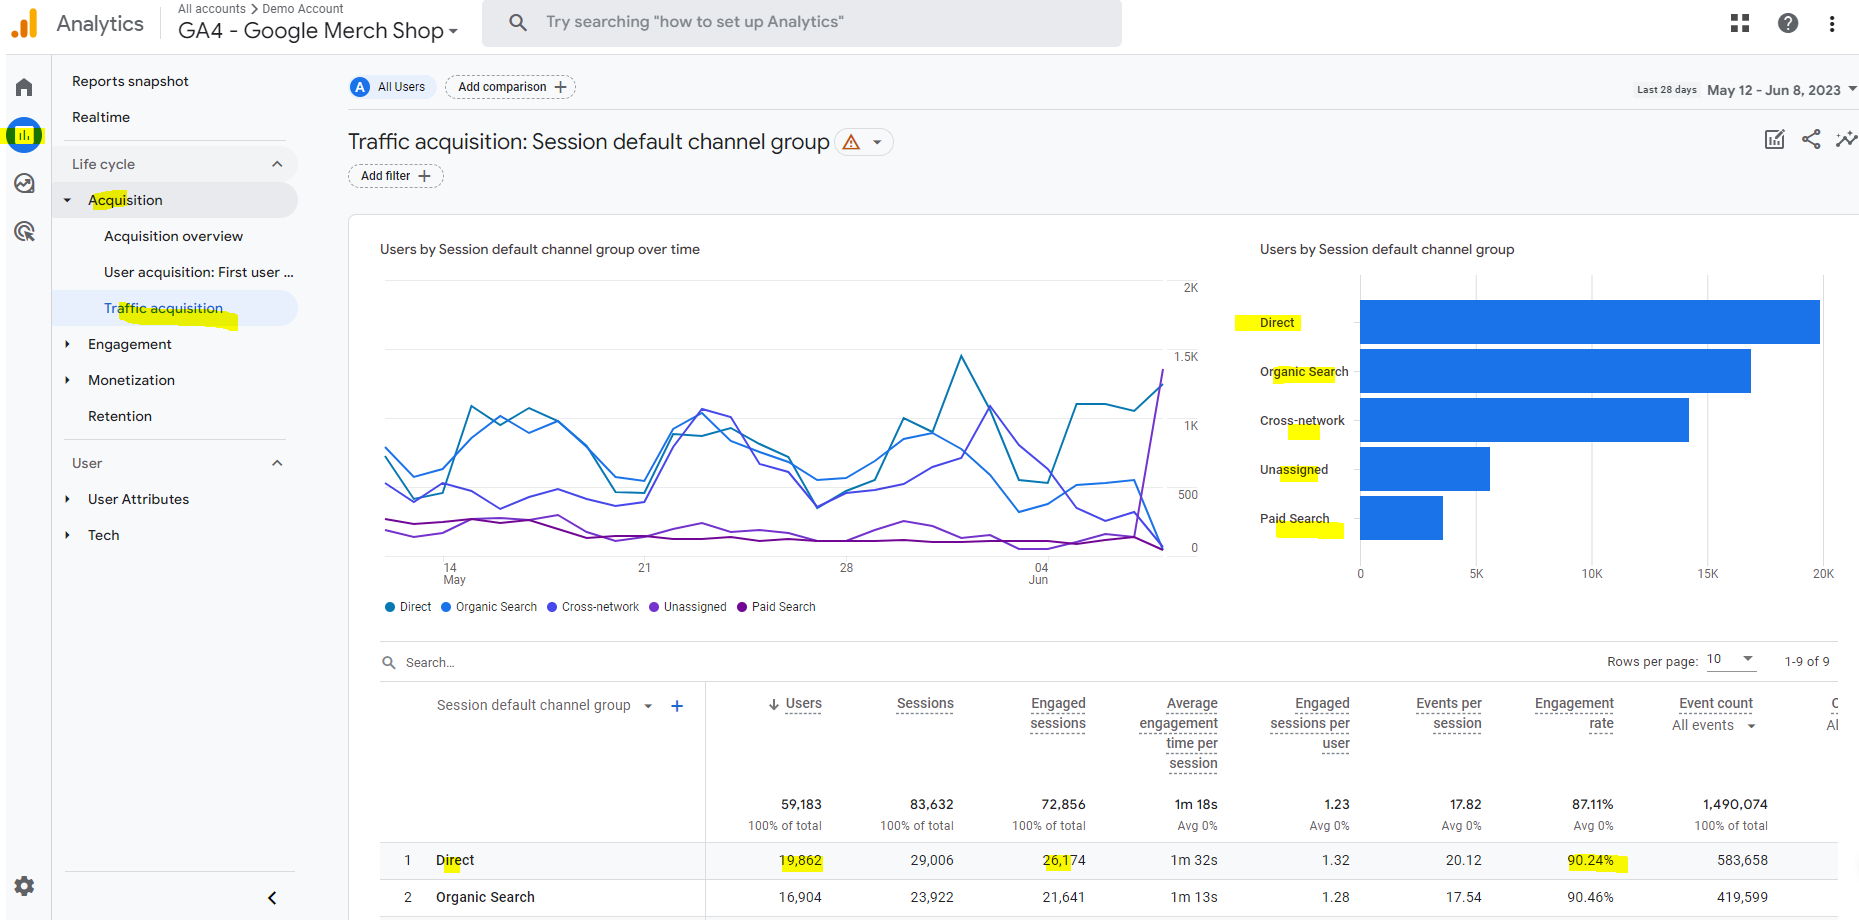
“bounce rate” in GA4 – is the opposite of engagement rate. So if engagement rate in GA4 is 60%, then bounce rate is 40%
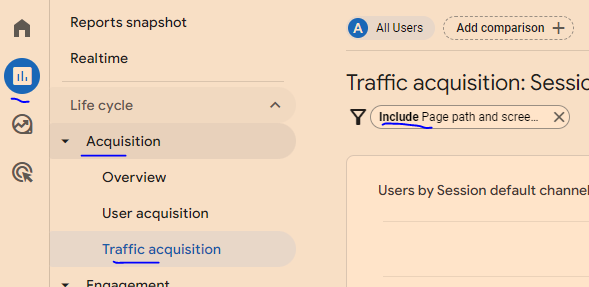
Find Engagement rate in REPORTS > Acquisition > Traffic acquisition
You can add a filter (top left of screen – by the page title) – to filter to specific pages
GA4 Home screen
The home screen gives you a summary or snap shot of your websites performance.
On the top right are real time stats
On the second row, you have recently viewed reports
Below is “insights”, which help you interpret the data
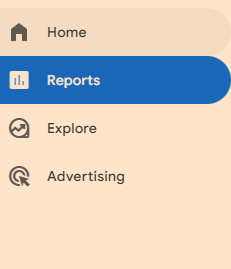
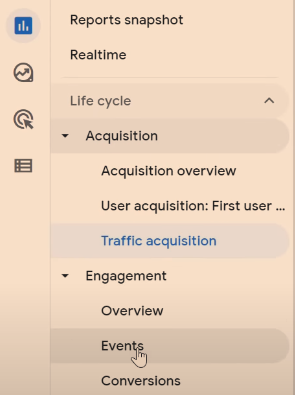
Reports
Reports tab gives a number of prebuilt reports:
Lifecycle Reports
-Acquisition
Where visitors are coming from
-Engagement
What people are doing on the site
-Monetization
What people are buying (on eCommerce sites)
-Demographics and tech
Shows you stuff like visitor age, and what device they are using
EXPLORE SECTION
in this area you can create lots of visuals and insightful reports
ADVERTISING SECTION
purely for Google ads reports
CONFIGURATION SECTION
in the configure section, you can mark events as conversions, create audiences , set up custom dimensions and metrics, and access the debug view to test you’ve implemented stuff correctly.
Useful reports
Traffic sources – where are your visitors coming from, and where are the best visitors coming from
Reports- Acquisition > traffic acquisition
“Engaged traffic” an engaged session = been on your site more than 10 seconds, or visited 2 or more pages or converted
the traffic acquisition report let’s you see how engaged different source s of traffic are. For example, you can compare organic engagement rate vs paid ads.
in the Event Count, and conversions columns, you can click and choose from a dropdown menu which conversions you want to populate the data in the table.
EXPLORE
A good report to start out with in the explore section, is traffic sources.
Click “Free Form” to start.
On the default table, close the geo column by closing “town/city” on the left side of the screen
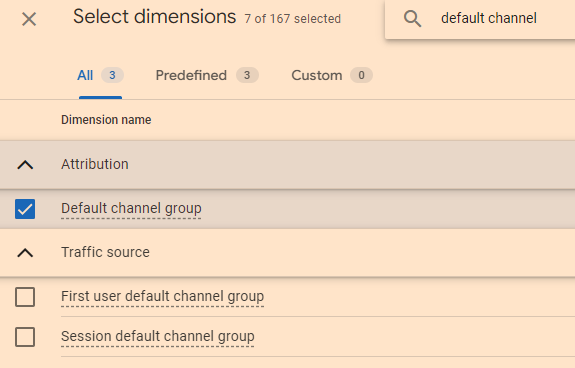
Go to DIMENSIONS on the left, click the +
Search for “default channel group” and tick the check box and click “IMPORT”
drag default channel grouping, into the rows area.
Now, for eCommerce, you’ll want to know the value each channel is bringing
On the left side, under VALUES, you’ll want to add transactions (scroll down to see VALUES, it’s below COLUMNS).
EXPLORE > FREE FROM
you can add country and other dimensions to the columns, and see which traffic source from which country (or town or something), drives the most value in terms of purchases or form submissions.
To learn more and isolate a channel, right click and select “include only selected”
for any referral traffic report, you can click the + above DIMENSIONS and search for and select “source”. You can then see which websites are referring the highest quality traffic
click the + icons to search for variables:
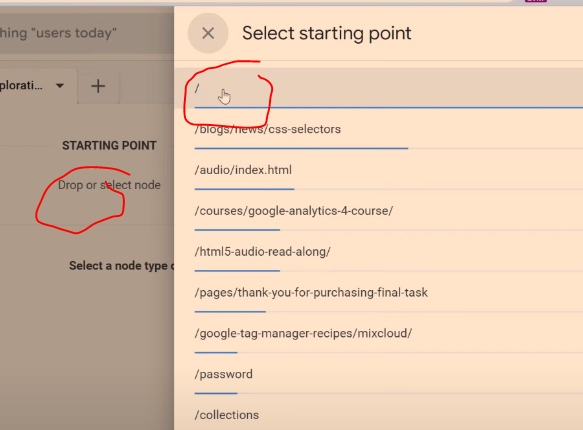
PATH EXPLORATION
see how people are journeying through you site
note “screens” is referring to mobile apps
e.g. the pages and screens report, “screens” refers to mobile apps
Useful premade reports:
REPORTING > ENGAGEMENT > PAGES AND SCREENS
“Scrolls” is an event that occurs when a user scrolls past 90% of the page
pretty much everything is an event, so event reports aren’t great. For example, exiting a website is an event.
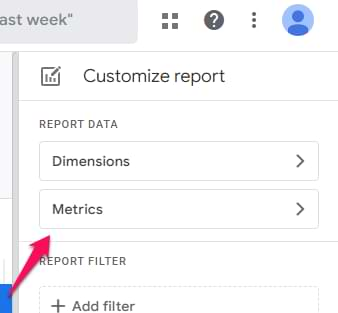
to make thus report a bit better, we want “engagement rate” added to the table.
click the pencil icon in
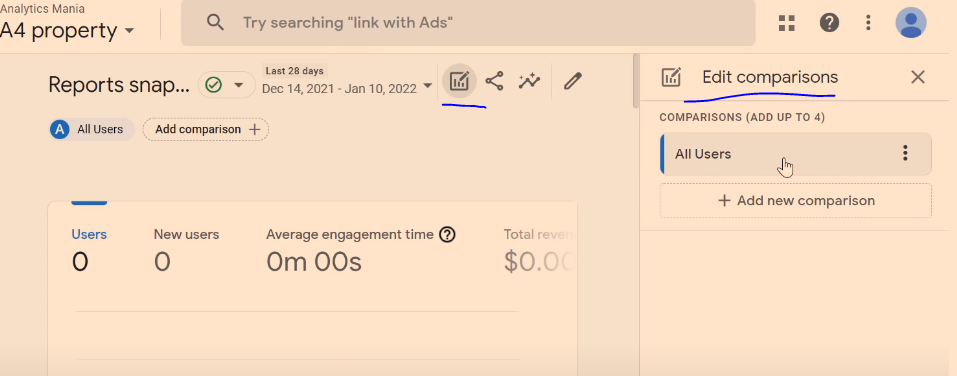
REPORTS – Snapshot
You can add comparisons, by clicking “Add comparison +” at the top, or by clicking the “edit comparisons” icon which is near the top right:
REAL TIME
Real time reports are from the last 30 minutes (it was 5 mins in GA universal)
You can also add comparisons on realtime reports
ACQUISITION OVERVIEW
These report, show traffic sources that bring visitors to your site
“You can use the User acquisitionreport to get insights into how new users find your website or app for the first time. The report differs from the Traffic acquisition report, which focuses on where new sessions came from, regardless of whether the user is new or returning.”
In the traffic acquisition report, if a user comes from organic search, and then later from paid search, both those sessions will show in the traffic acquisition report, but only organic would should in the User Acquisition report.
ENGAGEMENT
Events – you will see automatic events, like “scroll”, and custom events that you have implemented.
Conversions – “more important events” are conversions – like a purchase. These need to be configured manually.
Pages and Screens – see what people are doing on which pages. “Screens” is a term for mobile apps.
MONETIZATION
Needs sales tracking implemented.
You can see most popular proucts that have sold, how much revenue has been generated etc.
User Retention – Show how many users come back to the site. Don’t trust the data 100% due to cookies being blocked or expiring.
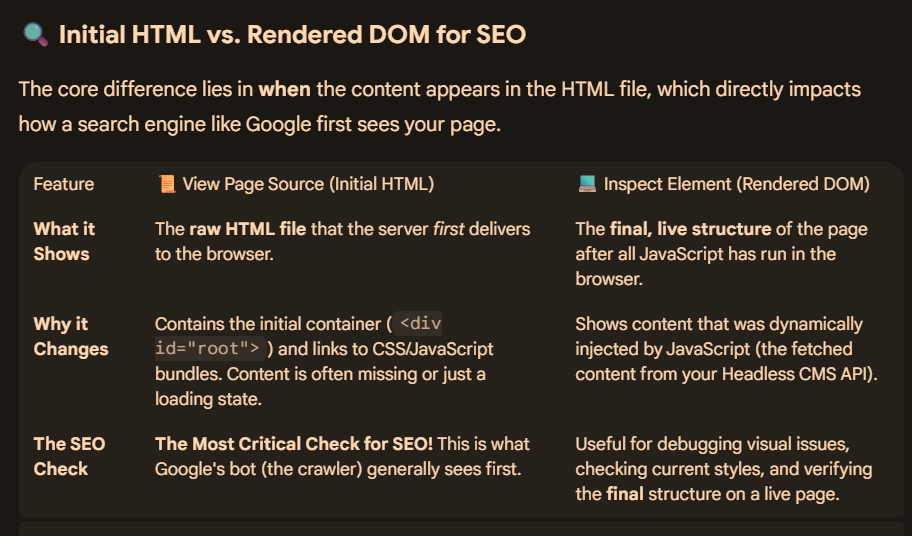
When you visit a page, the website sends HTML code to your browser. Often this source code includes additional resources such as scripts, which must be loaded, and which may alter the page code.
How to view Source HTML (Ctrl + U)
Right-clicking “show source” typically shows only the original page code returned to the browser, before scripts and other resources have been loaded and run. But there are many instances, particularly when troubleshooting your page, when you need to see the code of the final, rendered page on the browser, after all resources have been loaded, and any scripts run. For example:
To search for Google Analytics or Google Tag Manager tags used in verification.
To debug page loading and display (that is, to check that all libraries and other resources that you want to be loaded are).
To look at structured data on the served page.
How to view the rendered source (Inspect Element)
Here are a few methods to view the rendered source code for a web page:
In the Chrome browser: Right-click any part of the page and select Inspect to see all the HTML from the rendered page. Search for items in the rendered HTML with Control + F (Windows) or Command + F (Mac).
For a page on your own site:
Inspect the URL, either by entering the URL directly in the URL Inspection tool, or by clicking an inspection link next to a URL shown in most Search Console reports.
Click Test live URL > View tested page.
The HTML tab shows the rendered HTML for the page.
For a page on any site, not just a site that you own:
Update – I don’t think all the process below is required.
Just download the 404 – inlinks report from Screaming Frog
Bulk Export (very top, slightly to the left on the GUI)> Response Codes > Internal > Client Error 4**s
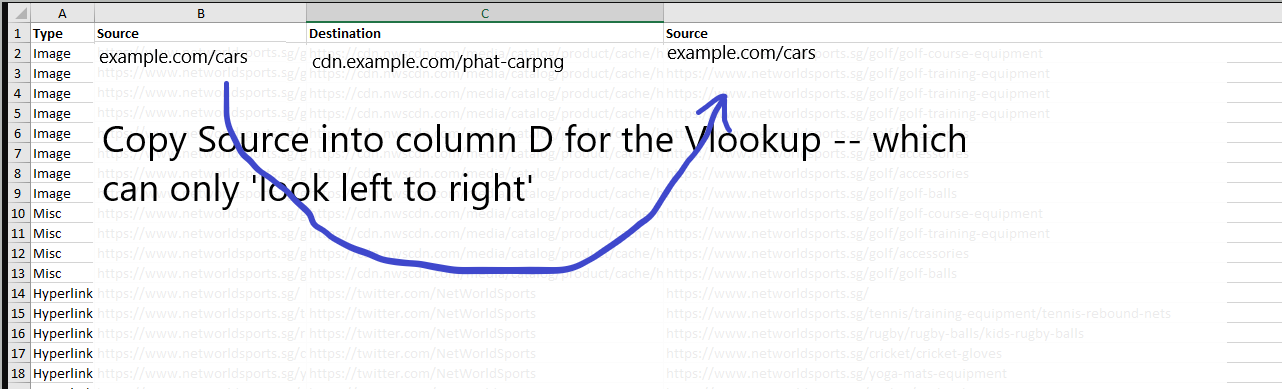
Copy the “Destination” (column C on report) column and paste into an new Excel tab/sheet and remove duplicates
In the first sheet, copy and paste the source column into column D
In the second sheet, do a vlookup using the first destination URL, and “lookup” in the first sheet – columns C and D, to return the relevant source URL
Copy the vlookup and Paste – values – into column A into the second sheet
You can also copy and paste the anchor text and location into column C
Follow this protocol, to produce a sheet you can send to devs etc, to remove 404s
This will get rid of the site-wide 404s and some individual 404s
In Excel – Copy and paste the “destination” URLs into a new sheet – into column A
Remove duplicates from the destination URLs that you’ve just copied into a new sheet
rename the colum – 404s Destination
Copy and paste the Source URLs and the Anchor Text into a new sheet.
Paste Source URLs in column A, and Anchor Text into column C
In cell B1 type – ” | ”
In cell D1 – give the column the heading “Source | Anchor”
In cell D2 concatenate – =CONCATENATE(A2,$B$1,C2)
Drag the formula down.
You’ll now have the anchor text and the source URL together, so you can vlookup the destination (404) URL
create a new sheet
Copy and paste all of the source URLs | Anchor Text (from the concatentate formula – paste special -values only
Copy & Paste Destination URLs from the original sheet into columns B and C in the new sheet you just made.
You need “destination” in column B and “Source | Anchor Text” in column C, as vlookup has to go left to right
So you’ll have – 404s Destination – Destination – Source | Anchor Text
Name column D in the new sheet “Example Source URL & Anchor Text” and in cell D2 enter the lookup – VLOOKUP(B2,B:C,2,0) (put “equals sign” before the V. Drag the formula down
Copy column A and paste into a new sheet. Name the sheet “Final”.
Copy column D with the vlookup and paste values into column B in the “Final Spreadsheet”
In “final”, you should now have all the unique 404s and an example of a page that links to those 404s with the anchor text.
You can use “text to columns” to seperate the source URLS and anchor text if you wish
If you’re sending the spreadsheet onto a dev or someone to fix the 404s, you are probably best sending the full sheet with all the inlinks to the 404s, plus the one you’ve just made. It depends how they go about fixing the 404s.
Once 404s have been fixed, rerun a crawl and recheck them.
look out for 404s that are classed as HTTP Redirects in the “type” column – these don’t seem to have a unique source URL. You may have to search for the URL in the search box in Screaming Frog and click the “inlinks” tab to see original link to the non-secure http page
If you like, before you send off the report to someone, you can double check the “destination” URLs definitely are 404s, by pasting them into screaming frog in “list” mode
The best report in Screaming Frog to see the source and destination of all 404s – is to go to Bulk Export at the top menu:
And then Response Codes – Client Error Inlinks
In the Exported Excel Sheet:
Copy the “destination” column
Paste into a new sheet/tab – In Column B
Remove duplicates
Back in the first sheet – Paste “Source”, into column D to the right of “destination” in first tab/sheet
In the second sheet – Do a vlookup in the second sheet/tab – to import a source URL to each unique “destination” URL Add the word “source” to cell C1 in the second sheet
I think you have to click the file name to download the example sheet below:
Just double click / drag it down to complete the lookup
You can add more lookups and columns to provide more details about the link location.
Just copy and paste values on the last Vlookup.
Paste another column like “Anchor” into column D on the first Tab
Paste the vlookup into the adjacent column
“0” means nothing found – i.e. no anchor text etc
Update –
404s found in the Navigation or “Aside” tend to be site-wide, so you can find one instance of this and update the 404 and Bob’s your uncle.
If a 404 is within the page content/copy however, they are possibly unique and need fixing individually. So take a look the Content 404s separately. They probably only have 1 source URL so no need to faff with vlookups etc.
Find URLs that should have a hreflang tag – Indexable URLs
Crawl the website with Screaming Frog – in configuration crawl and store Hreflang
Download the “internal” report on first tab
Filter relevant columns to find all URLs that return 200 (Status Code), are indexable (Indexability)
Check Canonical URLs are Correct and Indexable
From the internal Report – filter status code to 200 only and Indexable
Paste the filtered columns into a new tab/sheet and delete irrelevant columns so you just have URL and Canonical columns
Use =Exact formula to find all URLs that match the canonical URL – add an extra column for this and call it “exact?”
For canonical checks – filter to “FALSE” and see which URLs don’t have self ref canonicals
Back in Internal – Original Spreadsheet
unfilter the internal report.
Filter to show all the canonical URLs. Canonical Column – filter – untick “blanks”
Copy and paste into Screaming Frog , list mode – check status code of all these canonical URLs
For Hreflang – Filter Canonical URL – “exact?” column to “true”
You should be left with all URLs that are indexable (and should therefore have hreflang if an international site) – i.e. 200 status codes and URLs that exactly match canonical URLs.
Hreflang Checks
For the indexable URLs found above, check hreflang using:
Go to screaming frog GUI – and the Hreflang Window
Order by Occurrences – check if any URLs have less hreflang then they should have
Check all the reports in the drop down menu on the left
Non-200 Hreflang URLs – URLs within the rel=”alternate” markup that don’t result in a 200 status code
Download the non-200 hreflang report – by going to the “hreflang” tab in Screaming Frog.
Delete all the columns except those containing the actual hreflang URLs
Then in the column adjacent to all the hreflang URLs add the formula: =INDEX($A$1:$G$126,CEILING(ROW()/7, 1),MOD(ROW()-1,7)+1)
The formula above would be used if the hreflang URLs are in columns A to G, and the last row that is populated in number 126. You’ll also need to update the number 7 in the formula – for example if you have 5 columns of hreflang URLs, then change 7 to 5.
Drag this formula down until you start seeing #REF! errors, indicating you’ve covered all the data in your original columns
You should now have all the hreflang URLs listed in the non-200 hreflang report
To find the specific URLs that are non-200 – paste the last column containing all the URLs, into screaming frog in “List” mode
Export the List mode ‘crawl’ from Screaming Frog and filter by status code
Unlinked Hreflang URLS – Page sthat conain one or more hrelgang tag / URL that’s only linked to by a hreflang tag and not in the actual webpages
Missing Return Links – Hreflang should be recipricol.
Inconsistent Language & Region Return Links – This filter includes URLs with inconsistent language and regional return links to them. This is where a return link has a different language or regional value than the URL is referencing itself
Non Canonical Return Links – URLs with non canonical hreflang return links. Hreflang should only include canonical versions of URLs.
Noindex Return Links – Return links which have a ‘noindex’ meta tag. All pages within a set should be indexable,
Incorrect Language & Region Codes – This simply verifies the language (in ISO 639-1 format) and optional regional (in ISO 3166-1 Alpha 2 format) code values are valid
Missing Self Reference – URLs missing their own self referencing rel=”alternate” hreflang annotation. It was previously a requirement to have a self-referencing hreflang, but Google has updated their guidelines to say this is optional. It is however good practice and often easier to include a self referencing attribute.
Not Using Canonical – URLs not using the canonical URL on the page, in it’s own hreflang annotation. Hreflang should only include canonical versions of URLs.
Missing – URLs missing an hreflang attribute completely. These might be valid of course, if there aren’t multiple versions of a page.
Outside <head> – Pages with an hreflang link element that is outside of the head element in the HTML. The hreflang link element should be within the head element, or search engines will ignore it.