Rest paramaters are represented by 3 dots and then an array name
It is very similar to the spread operator – using the same symbol – 3 dots.
However, the rest pattern is used within a function’s parameters
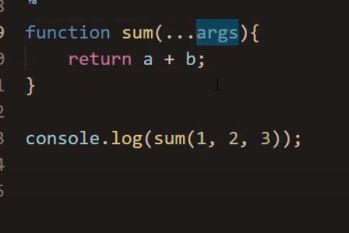
Say you have a function called sum, with 2 parameters – a + b
But we add a third argument – the third argument will normally be ignored.
Using the rest parameter, as shown below, you can now store all the arguments, into an array, named “args”
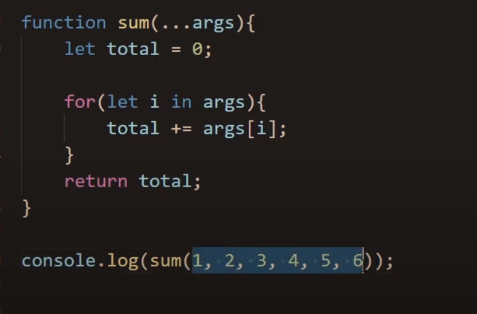
Now rewrite the funcition, with a loop and you can write any amount of arguments and they will be added:
I asked Chat GPT to explain the rest parameter to me like I’m 10:
Imagine you and your friends are at an ice cream shop. There are lots of flavors to choose from.
Now, think of a JavaScript function as the ice cream shop owner. When you order your ice cream, you might say “I want chocolate, vanilla, and strawberry.” But your friends might order different flavors or a different number of scoops.
To handle this, the shop owner (our JavaScript function) uses a special bucket, called the “rest” parameter. No matter how many flavors you and your friends order, they all go into this same bucket.
In JavaScript, this is like when a function uses “…args” as a parameter. For example:
function orderIceCream(...flavors) { console.log(flavors); }
Here, ‘flavors’ is our special bucket. If you call orderIceCream("chocolate", "vanilla", "strawberry"), the function will print ["chocolate", "vanilla", "strawberry"]. And if your friend calls orderIceCream("mint", "rocky road"), the function will print ["mint", "rocky road"]. No matter how many flavors (or arguments) you give the function, they all get collected into the ‘flavors’ array. That’s the magic of the rest parameter!
One important thing to remember is that the rest parameter (...flavors in our example) should always be the last parameter in your function, because it’s like the shop owner’s “catch-all” bucket for all remaining ice cream flavors you order.
I hope that makes sense! Let me know if you have any other questions about JavaScript.
You can view code in Chrome, by right-clicking on a webpage and clicking “view page source”
You can see the code of the page, but you can’t do much with it.
Instead, you can right click and choose “developer tools”
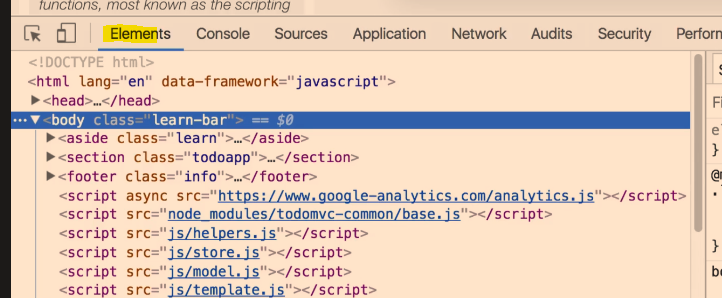
The elements panel is normally the default panel that you see:
As you hover over items in the Elements tab, it will highlight the relevant part of the webpage too.
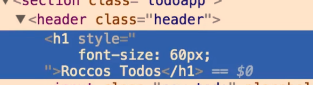
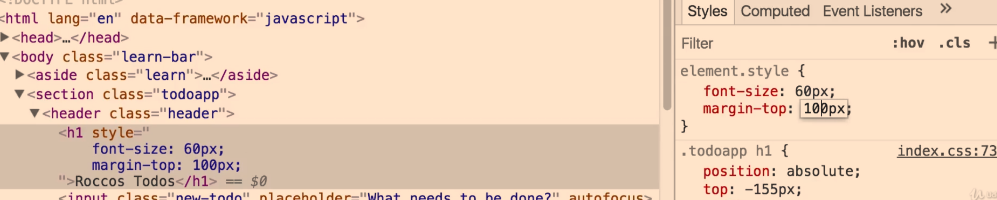
You can right-click and choose “Inspect Element” and the Dev Tools window will open up, with the relevant piece of HTML code highlighted. For example, if you click the main header of a page, and choose “Inspect Element”, there’s a good chance you’ll be taken to the elements tab and have a “<h1>” highlighted.
You can change the text if you like, and the style – by typing and editing it in the styles panel on the right:
You can click the “+” symbol to add a new style (I couldn’t be arsed putting this screen snippet into Paint to used proper type-text):
You can right click > Inspect an element and click the delete key to get rid of a style
Click on the colour picker to get a eye-dropped tool and other colour-picker options to change colours used on the webpage:
Chrome Developer Tools
Click the mobile icon – to see a website previewed on a mobile phone – you can change the phone model with the drop down menu
Console Tab
You can type console.log javascript code. This allows you to see the output of JavaScript code.
Web developers log messages for 2 general reasons:
Making sure that code is executing in the right order.
Inspecting the values of variables at a certain moment in time.
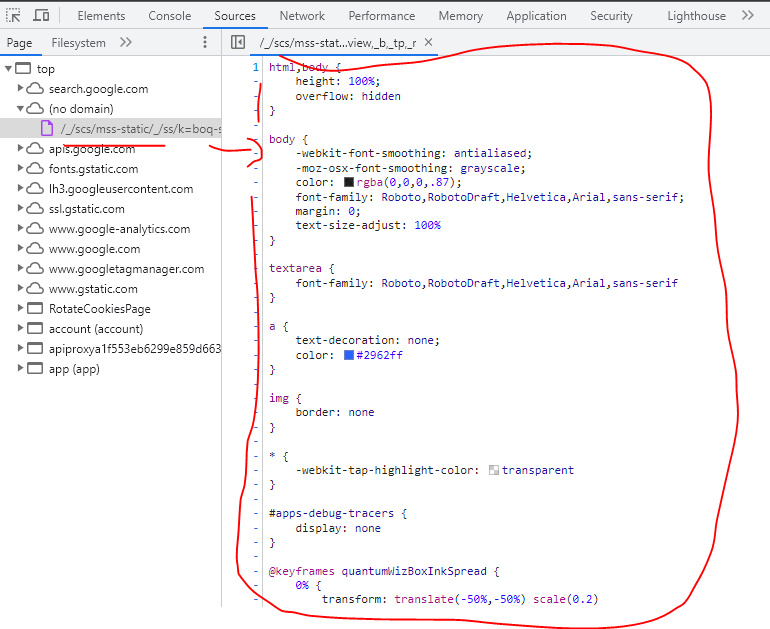
Files and folders that have been loaded by the webpage, can be found in the Sources tab – e.g. type Jquery to see if a page is using jquery
It’s often used for debugging JavaScript:
“Top” – The top-level, such as top on the screenshot above, represents an HTML frame. You’ll find top on every page that you visit. top represents the main document frame. (more info here)
The second-level, such as developers.google.com on the screenshot above, represents an origin.
The third-level, fourth-level, and so on, represent directories and resources that were loaded from that origin. For example, on the screenshot above, the full path to the resource devsite-googler-button is developers.google.com/_static/19aa27122b/css/devsite-googler-button.
You can click individual files to view them in the preview pane in the middle:
Edit CSS and JavaScript
You can edit code and see the changes immediately on the webpage
CSS changes take effect immediately, no save needed. For JavaScript changes to take effect, press Command+S (Mac) or Control+S (Windows, Linux). DevTools doesn’t re-run a script, so the only JavaScript changes that take effect are those that you make inside of functions.
You can save snippets of code and run them on any page
Application Tab
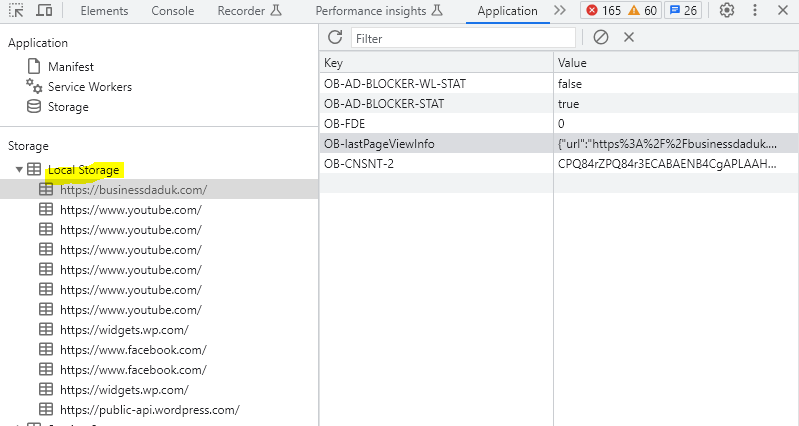
See local storage – Open the local storage section – you can see, well the local storage:
I have no fucking idea what any of this stuff means at the time of writing. I think the {“url” etc is some type of JSON
The DOM – can be seen in the Elements Tab of Inspect-Element, allows you to:
Review various content elements includng meta title
Verify if Google can crawl it
A key thing to look for here is the differences between source-code and the contents of the elements tab.
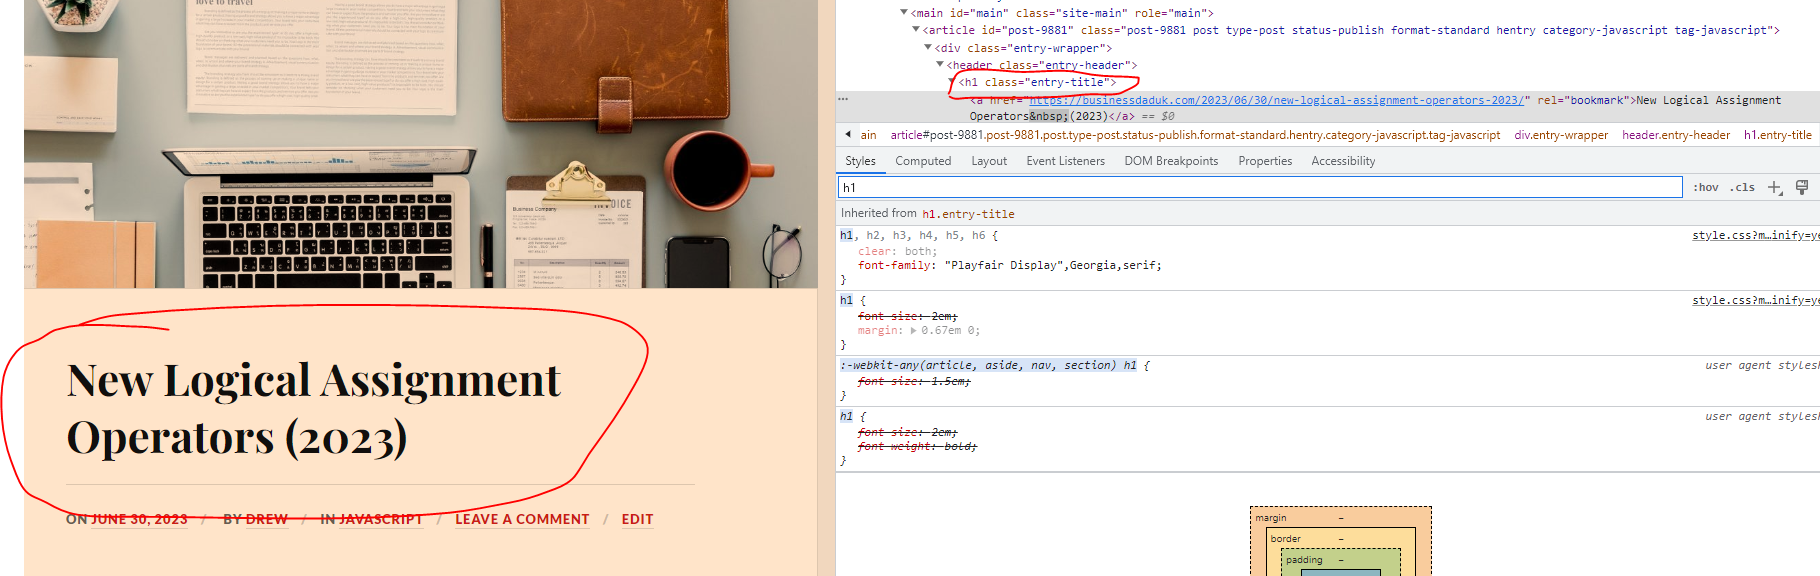
Fucking JavaScript When auditing websites that have heavy JavaScript usage, content – such as page headers – sometimes appears fine in the HTML source code. But if injected via JavaScript, it may just show as a JS block in the Elements tab.
This can potentially be an issue, later verified through performing a site:example.com/page “content you’re looking for” advanced search and checking the cached version of the page.
The blog heading here, appears to be fine and stuff:
2. Check on mobile devices
Use the mobile icon on the top menu-bar, next to the “elements | Console” tab options, to see the page in different mobile devices
3. Site Speed
This can really be useful if you’ve blocked your staging website and 3rd party tools can’t access your URL
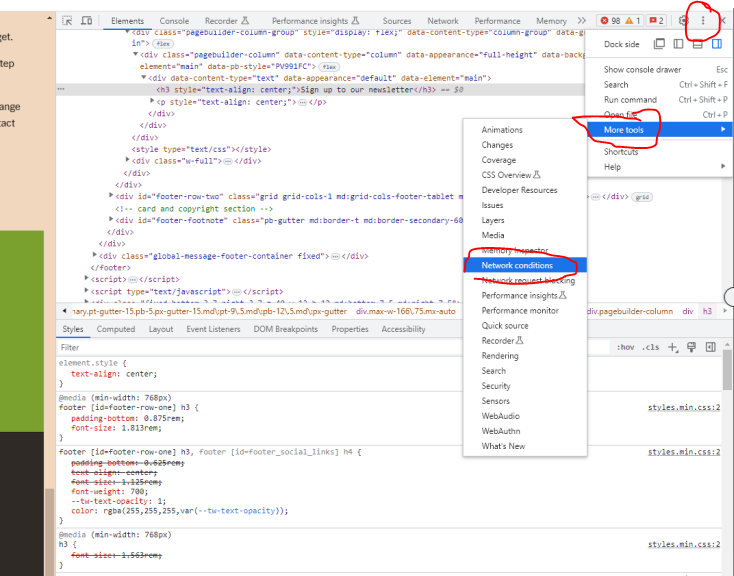
From the three-dot burger menu in the top right of the screen, you can access Network Conditions (found under More Tools).
you can throttle the network to slow 3G etc
Disable broswer cache
You can also select from a number of user agents ranging from Googlebot Smartphone through to various Microsoft Edge UAs, and Opera.
Once you have setup the setting for the network – go to the NetWork Tab, and see the page load
4. Render Blocking Resources
As mentioned previously, from the Network tab you can identify which JavaScript and CSS resources are being loaded before the DOM.
While this isn’t necessarily an issue on all websites, having resources load ahead of the DOM can potentially lead to it being blocked, which is one of the more common and resolvable site speed issues.
These can be identified by filtering for JS and CSS in the Network tab:
You can also see which elements, JS, CSS etc have a 200 status code, and which 404 or are blocked
In order to switch your user-agent in Chrome, use the Network Conditions tab in the console drawer.
Sometimes security measures on a website might stop Googlebot from crawling
Using the User-Ageny tool in dev tools, it’s possible to see if bots are getting blocked
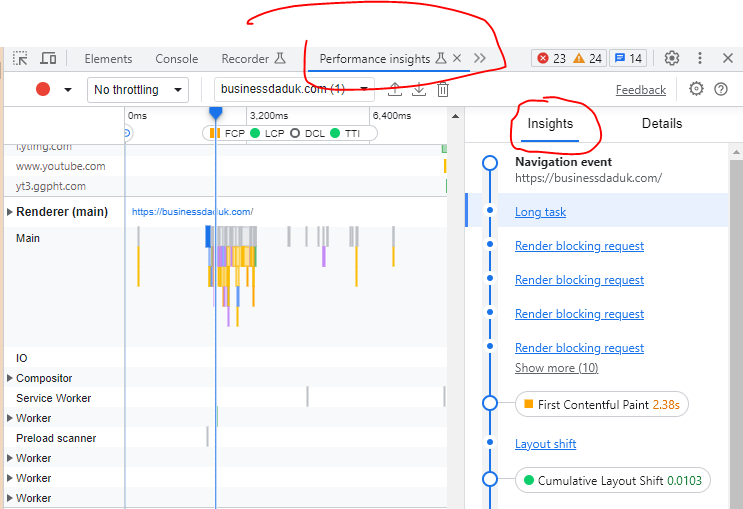
Diagnosing Core Web Vitals in DevTools
Within the timings section, users can see flags for things like FCP (First Contentful Paint), and LCP (Largest Contentful Paint), one of our Core Web Vitals.
In hovering over the flag for LCP, we can actually see the piece of content flagged to be the largest contentful paint during the page load.
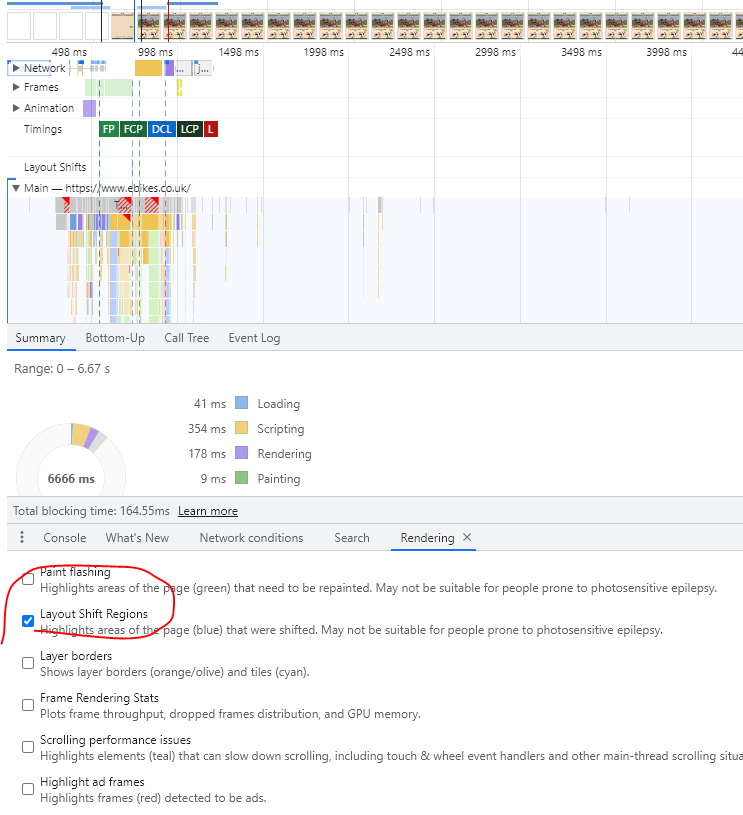
In order to help detect layout shift, use the Rendering tab in the console drawer:
Check the option for Layout Shift Regions, which will highlight areas of the page that undergo a layout shift as content is loaded. (when you go back to the performance tab and refresh)
Layout shifts will then be highlighted in blue as you interact with the page.
3. Double-Check Your HTTP Headers & Review Unused Code
After selecting a resource, the Headers sub-menu in the Network tab allows us to see a host of information regarding the selected file. (headers appears when you click and choose a file)
This includes all HTTP header information, like the Request URL, the Request Method, the Status Code, content-encoding, last-modified date, server, and so much more.
You can lean on this info to:
Verify GZip compression is enabled.
Double-check that cache-control is working as expected.
Verify we’re sending Googlebot and other user-agents the appropriate status code.
View the DOM in the Elements panel, to make sure Google can see it
Use this to review the content of any of the page’s elements (such as the title, meta description or page text) to verify that the desired relevant information is shown in each case, to make sure it’s accessible to Google.
When identifying these differences between the content shown in both, you can then take the appropriate steps to verify it’s being indexed correctly: reviewing the page cached version in Google, verifying if the text is being shown in Google’s results when searching for it, using the “Fetch as Googlebot” in Google Search Console and so on.
3. Find Unused JavaScript & CSS
To look for unused JavaScript & CSS open the Chrome Web Devtools, go to elements and press ctrl+shift+P and type coverage; and then select [Show Coverage]
After selecting show coverage you will see the below screen, now you have to click on reload button as you can see in the screenshot and that will finally lead you to the coverage report that will show you the JS & CSS files.
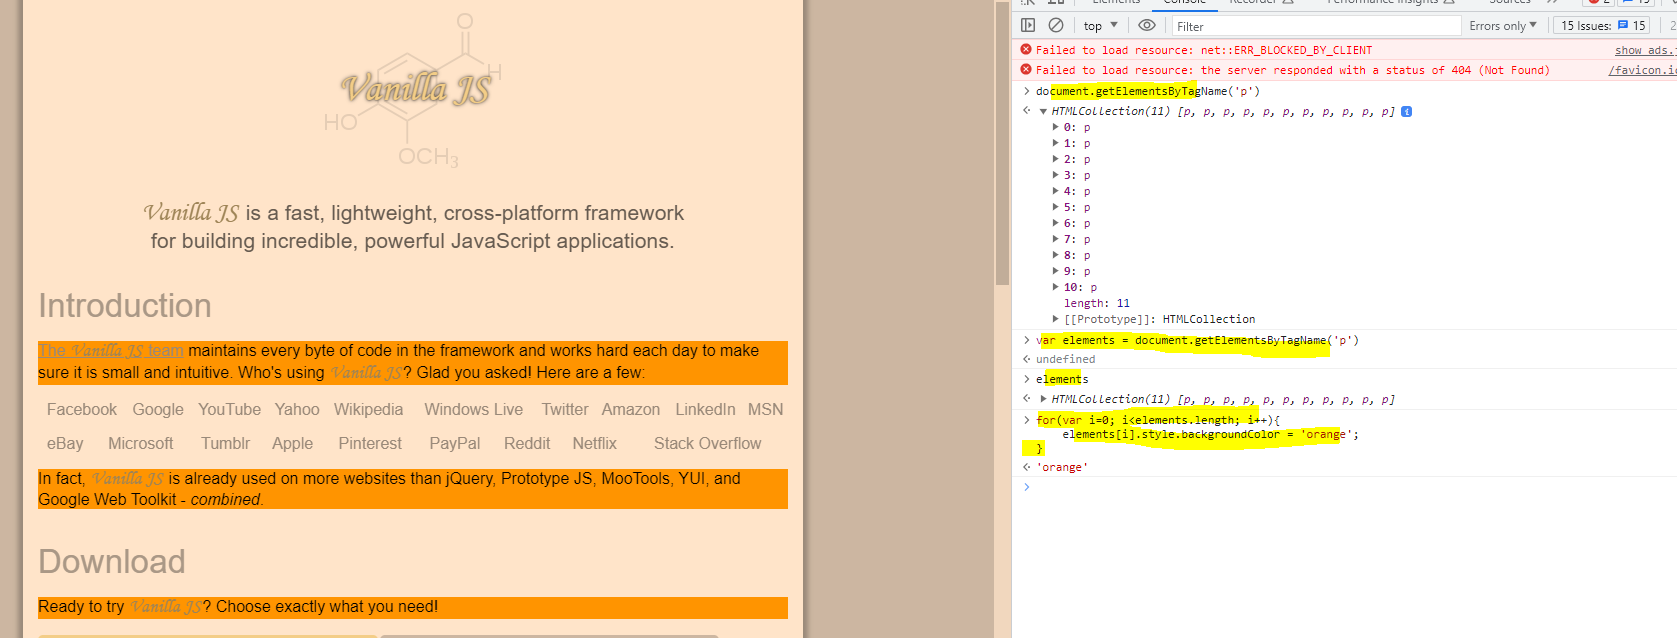
You can do a few nifty things, that seem a bit pointless at this point, like for example, calling and seeing how many paragraph <p> tags are on a page:
There are 5 paragraph tags, in the example shown above^
You can change the background colour of elements, like paragraphs:
Put the elements in a variable, and then change them with a loop^
Here i’ve changed the background colour of the paragraphs on vanilla-js.com:
Sources Tab & Basic Debugging
Right click on an element and select “inspect”
Go to the sources tab
You can click on lines of code to create a “breakpoint” so the code stops on that particular line of code
Breakpoints – pauses the code at a specific point
More info on setting up breakpoint to pause code in the Google documentation here
Line-of-code breakpoints
Use a line-of-code breakpoint when you know the exact region of code that you need to investigate. DevTools always pauses before this line of code is executed.
To set a line-of-code breakpoint in DevTools:
Click the Sources tab.
Open the file containing the line of code you want to break on.
Go to the line of code.
To the left of the line of code is the line number column. Click on it. A blue icon appears on top of the line number column.
You can view the local and global scope of the code
The “Filesystem” panel, tells you all the files that make up the current page:
Official Google Documentation for Chrome Dev Tools
Google has their own info and tutorial stuff on dev tools here.
Elements tab – we can see HTML representation of DOM – check page elements are in the DOM
Network tab – see what happens between the server and our browser. Reload page – and see each request from the server and the response You can see where time is spent. We can see each element/request – we can see how long it took including the time the server and download took. We can also see http/response headers – make sure there’s no X-robots tags if you want it indexed You can click on an element/request, then click on “initiator” and see what requested it:
Network tab can also be used to disable the cache, set network speed and the user agent.
Please note that Googlebot might not always work as expected, real Googlebot will respect robots.txt and some sites might do IP lookups to see if a request is really from a data centre.
Some SEO Checks using Developer Tools:
Dev Tools Checks
Inspect main elements – are they visible in the inspect window? e.g. right click and inspect the Headings – check <head> has meta title and desc
Check on mobile devices
Check all the elements result in a 200 – view the Network tab
Network Tab – Check with Googlebot
Console tab – refresh page – what issues are flagged?
Unused JS in the elements tab – coverage
Check for client rendered links using the code above , using the console tab
You can also use a “diff tool” to check the difference between a live DOM copied from dev tools and the view source code.
Margin:auto – will automatically center align your element:
“Auto margin is used by Apple, Google, Stripe, and other design leaders as a way to horizontally center elements. By setting auto margin to an element that has a defined width, you can horizontally center the element within the boundary of its parent.”
Well, these were introduced in 2021, according to the Udemy course I am doing.
the “=” sign, assigns values to things
When there’s additional stuff, before the “=”, like “&&”; then some kind of logic has to be fulfilled before anything is assigned.
Two vertical lines, or pipes – “||” are the “OR” operators
Logical AND Assignment (&&=)
This logical assignment operator only assigns the value if the left-hand side is truthy.
In JavaScript, two ampersands (&&) in an assignment operator form a Logical AND assignment operator (&&=). This is a newer addition to JavaScript, introduced in ES2021.
Here’s how it works:
Let’s say we have two variables, a and b.
If we write a &&= b;, it is a shorter way of saying:
“If a is truthy, let’s assign the value of b to a.
If a is falsy, keep a as it is.”
A “truthy” value is a value that is considered true when evaluated in a Boolean context. All values are truthy unless they are defined as falsy—i.e., except for false, 0, -0, 0n, "", null, undefined, and NaN.
So, &&= is checking if the first value is truthy and if so, it assigns the second value to the first one. If the first value is falsy, it remains unchanged.
This logical assignment operator only assigns the value if the left-hand expression is falsy.
This can be useful in cases where we want to keep the existing value if it does not exist, otherwise we want to assign a default to it.
The Logical OR Assignment (||=) is a shorthand way of performing a logical OR operation and an assignment in one step. This operator was introduced in JavaScript with the ES2021 specification.
Here’s a simple way to understand it:
Let’s say we have two variables, a and b. If we write a ||= b;, it’s a shorter way of saying: “If a is not truthy (meaning it’s false, null, undefined, 0, NaN, or an empty string ”), then assign the value of b to a. If a is truthy (meaning it has any value other than those falsy values), then keep a as it is.”
So, a ||= b; is essentially a shortcut for a = a || b;.
The Logical OR Assignment (||=) operator is a handy tool when you want to assign a default or fallback value to a variable if the initial value of the variable is not truthy.
I asked Chat GPT to explain the operator to me like I’m 10:
Alright kiddo, let’s have a little chat about this nifty tool in JavaScript called the Nullish Coalescing Assignment Operator, which is represented by ??=. Sounds pretty fancy, huh? Don’t worry, we’ll make it fun!
Imagine you’re playing a game of football with your mates. Now, you always need a ball to play, right? But sometimes, you might forget to bring your own ball to the game. In comes the Nullish Coalescing Assignment operator to save the day.
So, let’s say myBall is the ball you bring, and spareBall is a ball that’s always kept at the ground just in case. Now, you want to check if you’ve brought your ball. If you have, great, we use your ball (myBall) for the game. But, if you forgot your ball (meaning myBall is null or undefined), we then use the spareBall.
In JavaScript, we’d write this check as myBall ??= spareBall;. This means, “If I forgot my ball (myBall), let’s use the spareBall.”
So that’s it, bachgen (that’s ‘boy’ in Welsh)! The Nullish Coalescing Assignment Operator is like your safety net, always making sure you have a ball to kick around!
I asked chat GPT to explain the Nullish coalescing operator (??) to me, like I’m 10 years old:
Let’s imagine you have two boxes, one is called ‘boxA’ and the other is ‘boxB’.
Now, you’re told you can take a toy from boxA, but here’s the thing, sometimes boxA can be empty. If boxA is empty, you’re allowed to take a toy from boxB instead.
In JavaScript, this is what the nullish coalescing operator (??) does. If the value on its left side (boxA) is “null” or “undefined” (it’s empty), it’ll give you the value on the right side (boxB).
Let’s look at this in code:
let boxA = null;
let boxB = "Dinosaur Toy";

let myToy = boxA ?? boxB;
console.log(myToy);  // This will print: Dinosaur Toy
In this example, ‘boxA’ is null (it’s empty), so we move to ‘boxB’ and take the “Dinosaur Toy”.
But what if ‘boxA’ does have a toy?
let boxA = "Robot Toy";
let boxB = "Dinosaur Toy";

let myToy = boxA ?? boxB;
console.log(myToy);  // This will print: Robot Toy
Here, ‘boxA’ has a “Robot Toy”, so we take that and ignore what’s in ‘boxB’. It’s just like the rule we set at the start, we only check ‘boxB’ if ‘boxA’ is empty!
I hope that helps explain the nullish coalescing operator!
Notes from this video^
This operator works like the logical “or”, but is more strict
In this scenario, at the start of a game, the user has to provide the level of difficulty they want, and they also have the option of stating/providing at starting cash amount.
In this code, if they don’t provide a starting cash amount, they’ll get “500”
So the default for the “cash” is 500
If the user does provide a cash amount, then that gets used instead of the default.
I asked Chat GPT to explain Short Circuting in JavaScript to me like I was 10. I also asked for some jokes to be thrown in the mix.
“Hey there kiddo! You know how when you’re playing video games and there’s a super long level, but you discover a secret shortcut and skip straight to the end? Well, that’s kinda what we do in Javascript with something called “Short Circuiting”.
We use two super cool signs, “&&” and “||“.
Okay, first let’s talk about the two “ands” – “&&”. It’s like you and your best friend are on a secret mission. You both need to do your parts for the mission to be successful. If one of you fails, the mission fails. In Javascript, both sides of “&&” must be true for the whole thing to be true.
If the first part is false, Javascript doesn’t even bother to check the second part, because it already knows the mission failed! (this is the short-circuiting – it just quits)
Now, let’s talk about the two “ors” – “||“. This is like saying, you can have an ice cream OR a cake for dessert. If you get ice cream, that’s great! You don’t need the cake anymore (although, cake is always good).
Similarly, in Javascript, if the first part of “||” is true, Javascript takes the shortcut and doesn’t bother checking the second part.
Here’s a geeky joke for you: Why don’t programmers like nature? It has too many bugs! And don’t forget, always be like Javascript’s “&&” and “||”. Take the shortest path and save your energy for more video games! 😉”
Yea, so after reading that, I’m none the wiser, so here’s some notes from a video that I found on YouTube…
If price is more than 500 and less than 2000
Then print “hello”
If both operands are true, then print hello.
The “short circuit” occurs, because if the first parameter is not true, then JavaScript won’t bother running the second one.
So if the price was 400, and wasn’t greater than 500, then the JS would stop running and not bother to evaluate if the price is also less than 2000
It’s the same with the “or” operands, or operators, whatever they are called.
If the first condition is true, then it won’t bother running or looking at the second one, because with the “or” operator, only one of them has to be true.
I asked Chat GPT to explain the rest pattern and parameters in JS to me, like I was 11, and to add some welsh slang:
“Alright, kiddo, let’s chat about Rest Pattern and Parameters in JavaScript, tidy la?
It’s like when you’re at a sweet shop, and they’ve got all these fab sweets – Choc bars, bonbons, chewy toffees, and so on. But you don’t want to pick ’em all up one by one, do you? That’d take ages, innit? Instead, you want to scoop ’em up all at once, don’t you?
Well, in JavaScript, we’ve got this clever trick called the Rest Pattern. It’s like that sweetie scoop. Instead of grabbing arguments one by one, you can grab all of them at once. You can see this Rest Pattern when you see ‘…’ before a variable, like this: function fun(...args) { }. The ‘args’ here is like our sweetie bag, it’s holding all the arguments that were scooped up.
Now, these Rest Parameters, they’re proper tidy! Because all those arguments are now in one bag (or in an array, as we say in JavaScript), you can do things to the whole lot of them at once – like adding, subtracting, or whatever else you fancy.
So, remember, next time you want to scoop up a load of arguments in one go, the Rest Pattern and Parameters are your best mates, alright? Proper job, bach!”
The rest parameter, introduced in ES2015 or ES6, provides an enhanced method to handle function parameters. This makes it easier to manage a varying number of inputs as parameters in a function. A rest parameter lets us represent an indefinite number of arguments as an array, meaning a function can be called with any number of arguments, regardless of its original definition.
The syntax looks like this:
// '...' represents the rest parameter
function functionname(...parameters) {
  // function statement;
}
Notice when ‘…’ is at the end of the function parameters, it’s recognized as the rest parameter and stores any number of parameters as an array.
For example, let’s say we have a function without a rest parameter:
In this case, we can pass more arguments than defined parameters without causing errors. However, only the first two arguments are evaluated. The rest parameter changes this by allowing us to collect any number of arguments into an array:
// Example using the rest parameter
function fun(...input){
    let sum = 0;
    for(let i of input){
        sum += i;
    }
    return sum;
}
console.log(fun(1,2)); // Outputs: 3
console.log(fun(1,2,3)); // Outputs: 6
console.log(fun(1,2,3,4,5)); // Outputs: 15
Now, every argument is included when we call the ‘fun()’ function. The sum of all array elements is calculated using the ‘for..of’ loop.
Remember, the rest parameter must always be the last argument in a function, as it collects all remaining arguments into an array.
Here’s an example where the rest parameter is used with other arguments:
function fun(a,b,...c){
    console.log(`${a} ${b}`);
    console.log(c);
    console.log(c[0]);
    console.log(c.length);
    console.log(c.indexOf('Lionel'));
}
fun('Mukul','Latiyan','Lionel','Messi','Barcelona');
Output:
In this example, the rest parameter is passed as the third parameter. The first two arguments are treated normally, while the rest are collected by the rest parameter. Because the rest parameter produces an array, we can apply array methods provided by JavaScript.
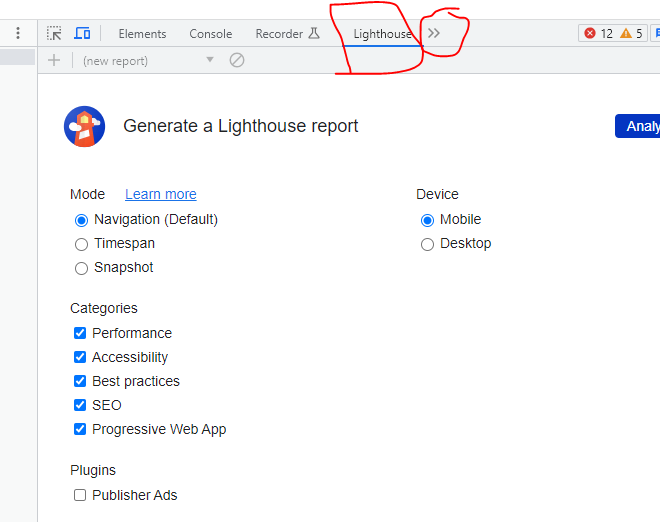
In the menu with the two arrows >> – you can click that and it has an option to analyze the DOM – which then gives you the number of elements and a few other bits
Just click the arrows, and then “Analyze DOM Size” and click the play icon