

I’ve made some notes on how to use the Inspect Element Tool – AKA Chrome Developer Tools.
Sorry about the change in layout for the images, I drafted this post on various computers and devices and used different software to annotate the screenshots.

The main thing that I use inspect element for at the moment, is to work out what’s cuasing
To launch Inspect Element right click and from the drop-down menu that appears, click “Inspect” at the bottom.
When you hover over any element, such as a H1 in the inspect-window, the element will also be highlighted in the view of the webpage.
- The small horizontal bar shows the location of the element you’re hovering over or selected

Elements > Styles Tab
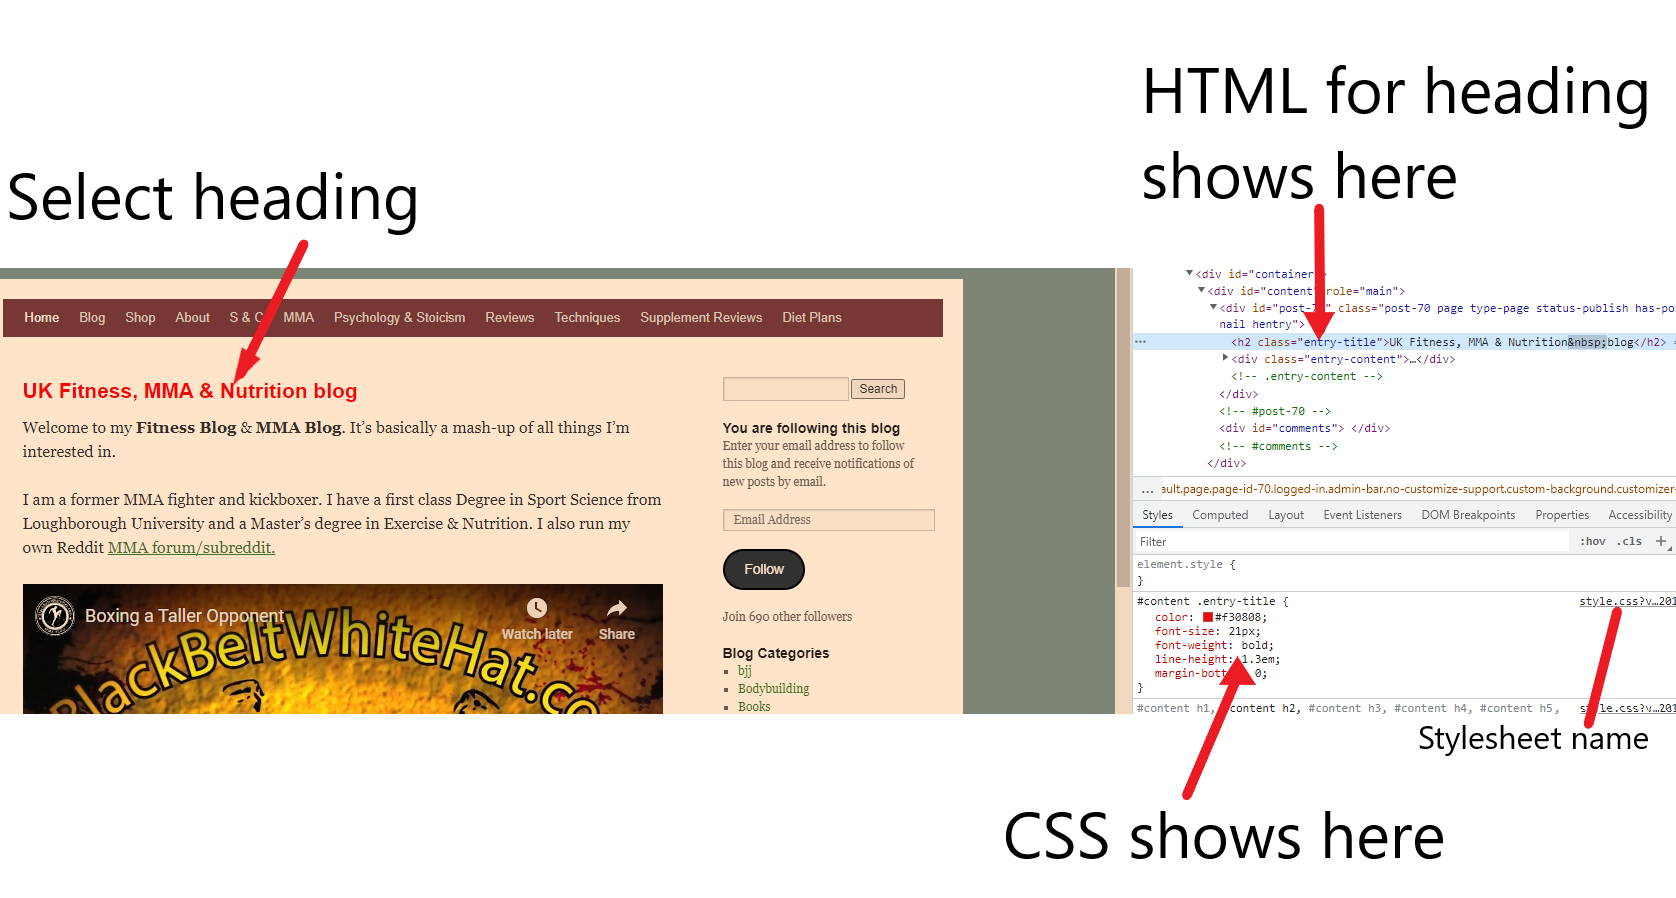
The styles tab, shows you the styles, or CSS for any element you’re hovering over on the webpage.
You can turn styles off and on, using the check box
on the opposite side of the style, it shows the location, or path of the CSS file
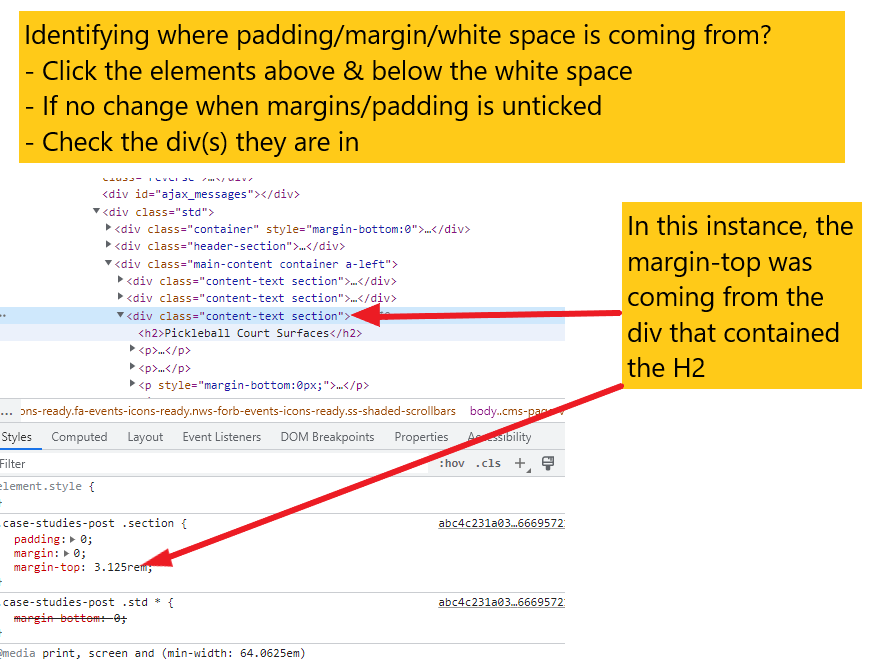
- I use this tab a lot to find out where spacing i.e. margins and padding is coming from – if it’s not from the individual element, that I can click on the container (usually a “div) and check the marings and padding values on that.

- You can also turn CSS styles on and off – a checkbox will appear next to each style when you hover over it
- Right click – copy element – and you can paste headers, images etc into another location on the page
- You can click & drag elements too

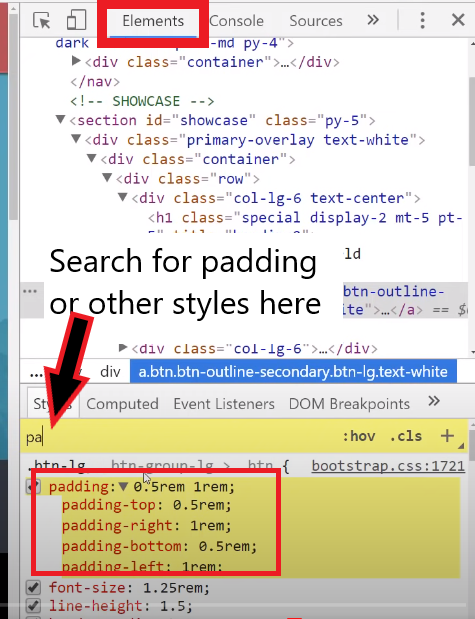
You can also search for specific styles using the box shown below:
-Computed Styles Tab
Computed styles, are the result of all the CSS in the Styles tab.

You can also clock the + icon to the right of .click, to add a new style to the elements tab. Remember to copy the css if you want to keep itz or you’ll lose it when you refresh the page.

You can use the horizontal box near the middle to search for styles and elements

– Forced Element State

With the Forced Element State menu open, you can tick different boxes and check how an element appears – for example a link, when it’s been clicked, or hovered over with the mouse.
– Console Tab
I’ve never got my head around this tab, but here goes.
- In the console tab, you can see all the Javascript and console log messages
- Can use it to check code is working, for example any “if/else” code, you can check which “option” your code took
- You can also see error messages
According to one of the tutorials I’ve read, this works best when running a code tool like Visual Studio. You can link up Visual Studio and test out your Javascript code real time.
- Refresh the page whilst you have the Console Tab open, you can check the console tab for any error messages
- You’ll likely get a load of error messages if you have an Ad Blocker extension
- You’ll get warnings and “violation” messages in yellow if you are using out of date frameworks or libraries e.g. JS
- The “no entry” icon will clear the console messages
The two Youtube tutorial below, should start at the sections talking about the Console tab:
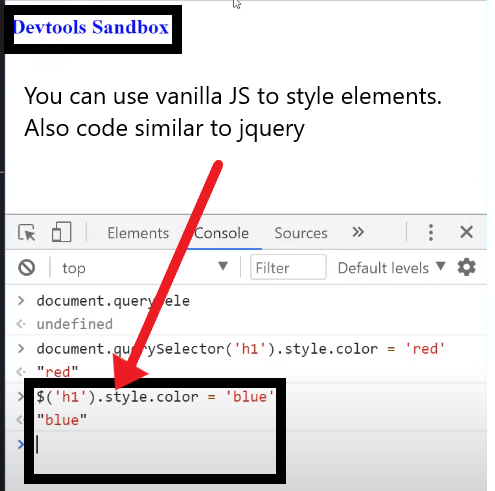
- You can run your own JS in the console tab. For example type “alert(1)” and click enter, you’ll get a pop up with the text “1” within it
- If you type in code, the line below will usually give you the return value.
E.g. if you type “1+3” the return value will be “4” - “undefined” means there is no return value
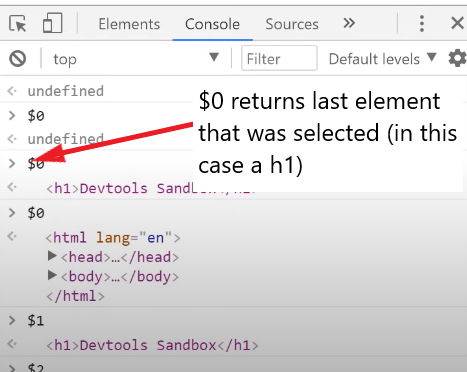
- $0 will return the last item you selected, $1 returns the second to last item you selected, $2 the third to last, etc.

Editing HTML in Visual Studio or another Code Editor
- You can also type code into the “webpage window” to the left, in this example:

**You will probably have to refresh the page to see the code output if you don’t have a visual studio plugin**
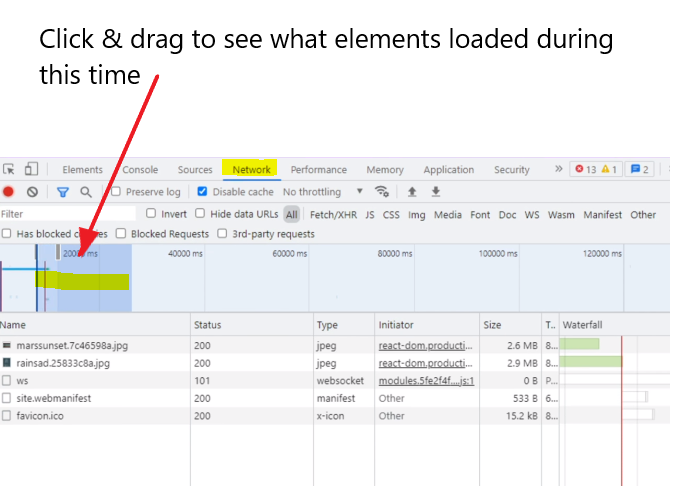
Network Tab
In this tab, you can see every element, and when it has been loaded
Using the “time bar” at the top, you can click and drag over different time periods and see what loaded.
For example, you can see what took the longest to load
- You may have to refresh the page for this to work ‘properly’
Sources Tab
In the sources tab, you can navigate different files related to the webpage.
If you are on the homepage, clicking “index” will show you all the HTML code
It’s good for trying to fix code without editing to source files
Lighthouse Tab
You can analyse page speed and performance here.
Alternatively, you can add the Lighthouse Extension for Chrome
Mobile Preview in Chrome Dev Tools
Click the mobile icon, and then choose a mobile device from the drop down menu to preview your webpage in a given device.

For a much more comprehensive (and better) guide, check out Google’s official documentation – https://developer.chrome.com/docs/devtools/overview/
