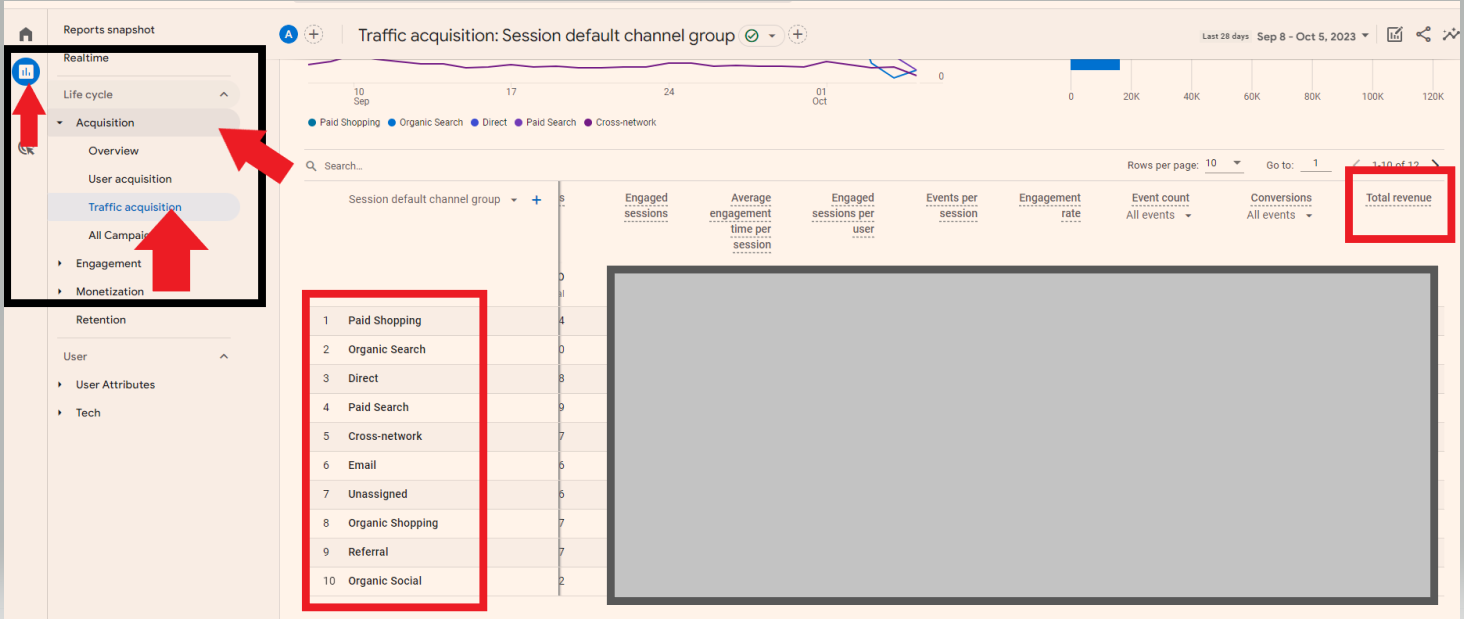
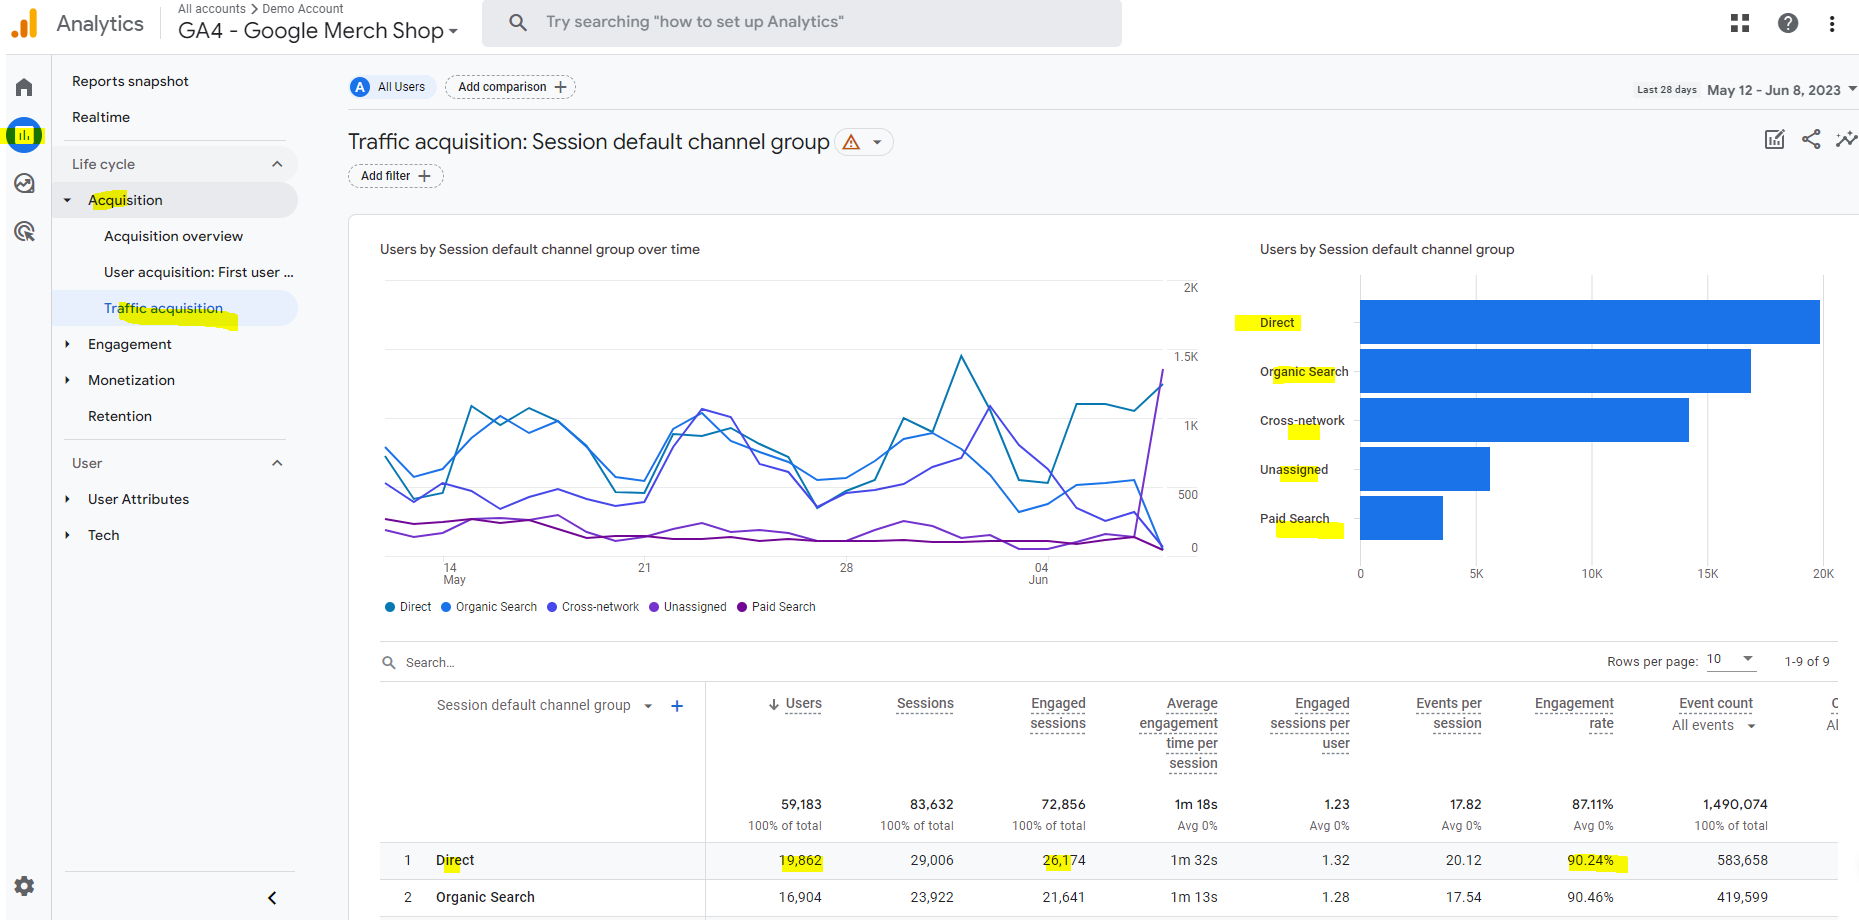
Reports – Acquisition – Traffic Acquisition – see channels and revenue – Scroll right to see revenue column in table:
Useful Report 2 – Browser & Device
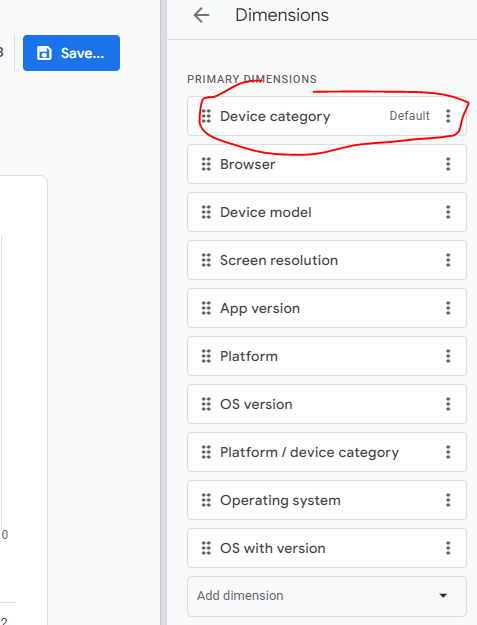
Reports – User – Tech – Tech details – Add filter for Device:
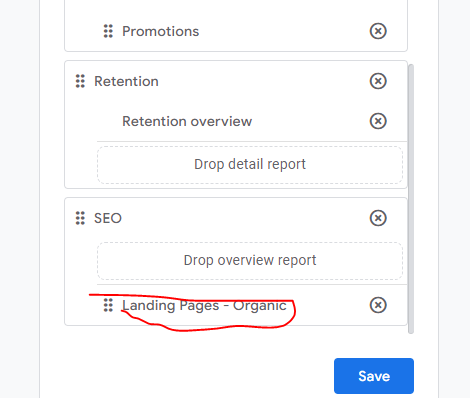
Useful Report 3 – Organic Landing Page Report in GA 4:
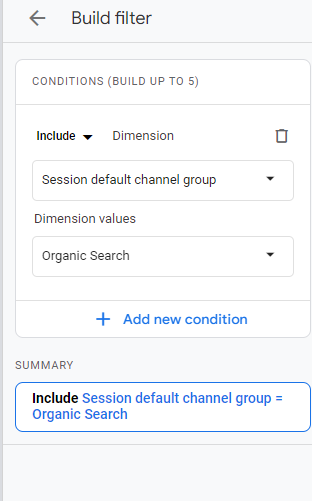
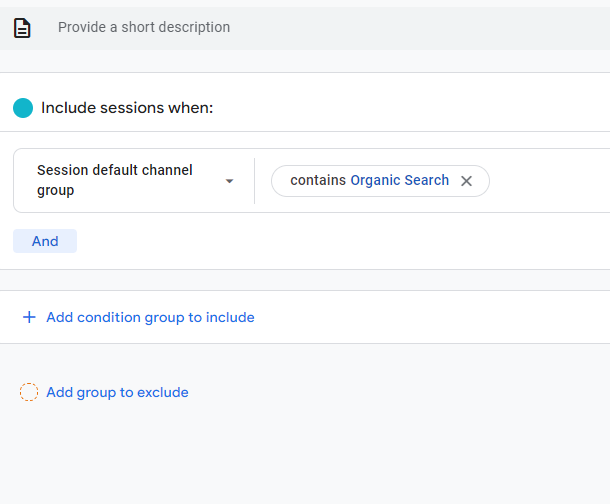
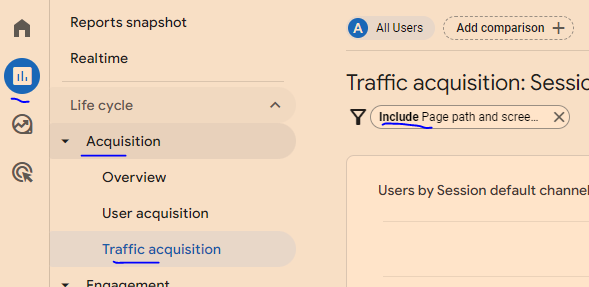
Reports – Acquisition – Engagement – Pages and screens – Add a filter by clicking top right “+” button Search for “session” and choose session default channel group – exactly matches – Organic search:
Reports – Life Cycle – Engagement – Pages and SCreens:
GA4 uses events for bloody everything.
You’ll need to set up one type of events – conversions, whilst others are set up for you.
Benefits of GA 4 Include:
You can track across app and website
Visualise buyer journeys easier
Easier to customise reports
BigQuery Exports
You can ask questions and get quick answers (in the search box at the top)
Things to note:
“bounce rate” in GA4 – is the opposite of engagement rate. So if engagement rate in GA4 is 60%, then bounce rate is 40%
Find Engagement rate in REPORTS > Acquisition > Traffic acquisition
You can add a filter (top left of screen – by the page title) – to filter to specific pages
GA4 Home screen
The home screen gives you a summary or snap shot of your websites performance.
On the top right are real time stats
On the second row, you have recently viewed reports
Below is “insights”, which help you interpret the data
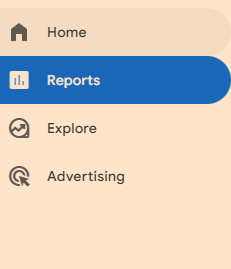
Reports
Reports tab gives a number of prebuilt reports:
Lifecycle Reports
-Acquisition
Where visitors are coming from
-Engagement
What people are doing on the site
-Monetization
What people are buying (on eCommerce sites)
-Demographics and tech
Shows you stuff like visitor age, and what device they are using
EXPLORE SECTION
in this area you can create lots of visuals and insightful reports
ADVERTISING SECTION
purely for Google ads reports
CONFIGURATION SECTION
in the configure section, you can mark events as conversions, create audiences , set up custom dimensions and metrics, and access the debug view to test you’ve implemented stuff correctly.
Useful reports
Traffic sources – where are your visitors coming from, and where are the best visitors coming from
Reports- Acquisition > traffic acquisition
“Engaged traffic” an engaged session = been on your site more than 10 seconds, or visited 2 or more pages or converted
the traffic acquisition report let’s you see how engaged different source s of traffic are. For example, you can compare organic engagement rate vs paid ads.
in the Event Count, and conversions columns, you can click and choose from a dropdown menu which conversions you want to populate the data in the table.
EXPLORE
A good report to start out with in the explore section, is traffic sources.
Click “Free Form” to start.
On the default table, close the geo column by closing “town/city” on the left side of the screen
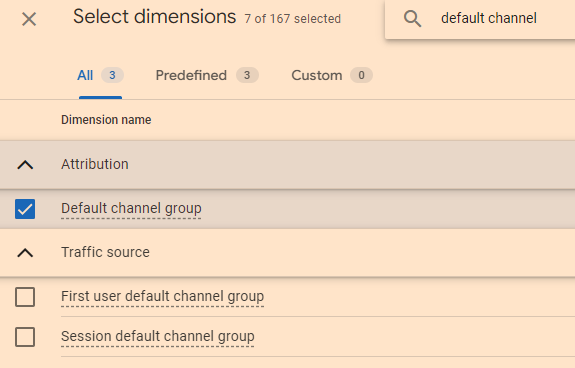
Go to DIMENSIONS on the left, click the +
Search for “default channel group” and tick the check box and click “IMPORT”
drag default channel grouping, into the rows area.
Now, for eCommerce, you’ll want to know the value each channel is bringing
On the left side, under VALUES, you’ll want to add transactions (scroll down to see VALUES, it’s below COLUMNS).
EXPLORE > FREE FROM
you can add country and other dimensions to the columns, and see which traffic source from which country (or town or something), drives the most value in terms of purchases or form submissions.
To learn more and isolate a channel, right click and select “include only selected”
for any referral traffic report, you can click the + above DIMENSIONS and search for and select “source”. You can then see which websites are referring the highest quality traffic
click the + icons to search for variables:
PATH EXPLORATION
see how people are journeying through you site
note “screens” is referring to mobile apps
e.g. the pages and screens report, “screens” refers to mobile apps
Useful premade reports:
REPORTING > ENGAGEMENT > PAGES AND SCREENS
“Scrolls” is an event that occurs when a user scrolls past 90% of the page
pretty much everything is an event, so event reports aren’t great. For example, exiting a website is an event.
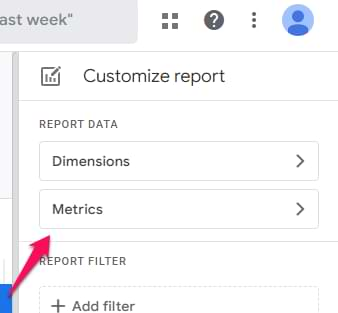
to make thus report a bit better, we want “engagement rate” added to the table.
click the pencil icon in
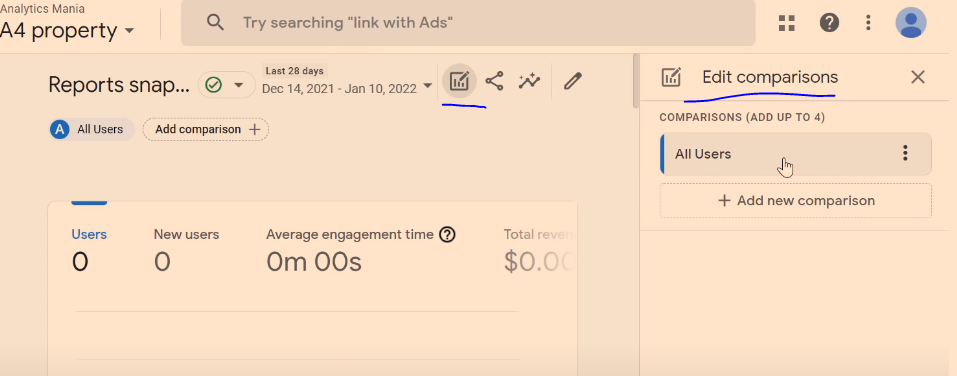
REPORTS – Snapshot
You can add comparisons, by clicking “Add comparison +” at the top, or by clicking the “edit comparisons” icon which is near the top right:
REAL TIME
Real time reports are from the last 30 minutes (it was 5 mins in GA universal)
You can also add comparisons on realtime reports
ACQUISITION OVERVIEW
These report, show traffic sources that bring visitors to your site
“You can use the User acquisitionreport to get insights into how new users find your website or app for the first time. The report differs from the Traffic acquisition report, which focuses on where new sessions came from, regardless of whether the user is new or returning.”
In the traffic acquisition report, if a user comes from organic search, and then later from paid search, both those sessions will show in the traffic acquisition report, but only organic would should in the User Acquisition report.
ENGAGEMENT
Events – you will see automatic events, like “scroll”, and custom events that you have implemented.
Conversions – “more important events” are conversions – like a purchase. These need to be configured manually.
Pages and Screens – see what people are doing on which pages. “Screens” is a term for mobile apps.
MONETIZATION
Needs sales tracking implemented.
You can see most popular proucts that have sold, how much revenue has been generated etc.
User Retention – Show how many users come back to the site. Don’t trust the data 100% due to cookies being blocked or expiring.
An Analytics account is your gateway to Analytics. An account can include multiple properties and property types, but a property can belong to only one Analytics account.
A property lives within an account. Properties are the containers for your reports based on the data you collect from your apps and sites. It’s the level at which Analytics processes data and where Analytics can connect with other Google products, like Google Ads.
A data stream lives within a property and is the source of data from your app or website. A property can have one or many data streams.
When structuring your Analytics account, remember this guiding principle: Each property should represent a specific user base.
Use separate properties to collect data from each user base you’re interested in understanding better — for example, a specific brand or region.
The new version of Google Analytics – Google Analytics 4 – has less pre-made reports and users are prompted to customise their own dashboards and use the search function.
You can literally ask questions, using the search bar. Which is fun.
Instead of pageviews and sessions, GA 4 is built around events.
Pre-configured reports are limited in GA 4. It’s a good idea to have Universal Analytics in addition to GA4
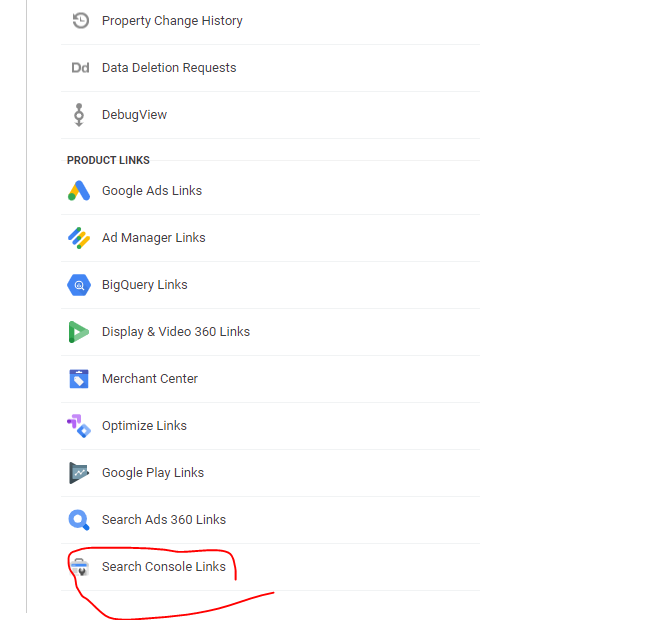
You can’t yet link GA 4 to Search Console
You can Can store raw data in BigQuery
when you install GA4 on your site, the reports don’t import data from GA universal – start from scratch – no historical data is passed over to GA4 when you install it on your site.
GA4 is Built Around Events.
Events:
You can track pageloads, elements clicked, product details, and loads more
Parameters:
Parameters are info that are sent to GA4 with the events.
Eg. Pageview is sent to GA4 with URL of the page, page title and the referral details
Automatic Events:
First Visit – first time someone visits site (this even populates the new user report too)
Page View – same as normal pageviews
Session Start – new session after 30 mins of inactivity
User Engagement – starts whens someone on your site for at least 10 secs
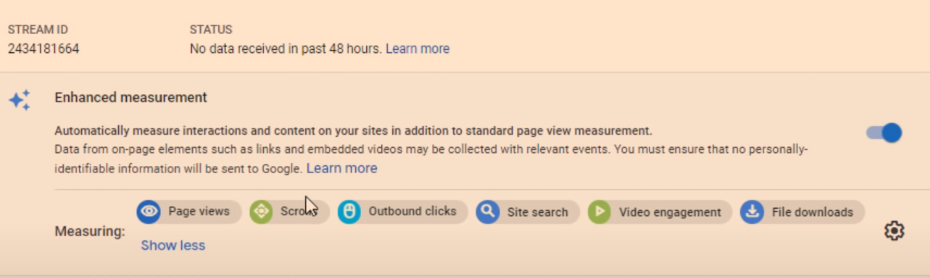
Enhancement Measurement
GA4 automatically tracks:
Scrolls – 90% of a page
Outbound Clicks –
Site Search – search queries
Video Engagement – for embedded YouTube videos
File Downloads
To edit the Enhancement Measurement reports go to “Data Streams” in the Admin area:
Click on data stream and check to see that “Enhanced Measurement” is switched to the on position. If you click on the cog icon, you can then switch different measurements on and off.
They’ll be set to “on” by default.
There are advanced settings for pageviews and site search – just click “Show advanced settings”.
Recommended Events
Google provides a list of recommended events for all websites and apps, and then by industry.
Retail & eCommerce
Jobs, Education, Local Deals & Real Estate
Travel
Games
Custom Events
Custom events allows you to name your events.
Google’s naming convention is probably best to copy – [action]_[object/item]
For example, if you create an event to track when people rate your website, call it:
Rate_item
Instead of
Product-rate
Add parameters such as product, item_id and rating – so you know which product is rated and what rating the user gave it.
You’ll need to register the parameters as custom dimensions or metrics
To make a new event – in the left hand nav/side bar – click –
Events – Create Event – Name the event
Enter the parameters to tell Google when to trigger the new event
E.g. page_location – contains – thank-you
Click “create” in top right corner.
You can create brand new events in Tag Manager – rather than basing them on existing events
Data Settings>Data Retention
By default GA4 only stores data for 2 months – in the Admin area, you can change this to 14 months.
Go to Admin>Data Settings>Data Retention and change it to 14 months on the drop down menu.
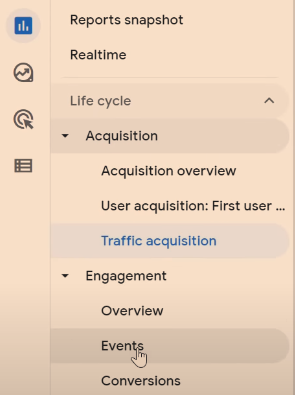
Brief Run Down of GA4 Reports (in the left hand side-menu)
REPORTS
Acquisition Reports – Where are visitors coming from? Looks at channels e.g. organic, and New Users Vs Returning Visitors
Click the “+” above the table, to add an additional dimension
1. Click the + above the table on one of the reports:
2. Add an additional dimension to the table, e.g. Page/Screen > Landing Page
Engagement Reports – What are visitors doing on your site?
To see pageviews and users per page:
Reports>Engagement>Pages and Screens
Monetization – New term for eCommerce Reporting in GA 4
See what items people are buying and how much money their spending
Retention – Looks at new users/visitors and returning visitors. See what percentage of different cohorts come back to the site etc
Demographics – Where are people based and what type of people are coming to your site?
Tech – what computers, tablets and phones are people using?
EVENTS
Conversions – conversions can be customised. But typically include “Begin_checkout” and “purchase”
All Events – basically less important events – compared to conversions. Include clicks, scrolls etc.
EXPLORE
Analysis – There is a Template Gallery (top right of screen)
You can look into funnels, acquisition etc and get cool reports
CONFIGURE
Audiences – you can build different audiences by location, device etc and analyse them
Remember, a property is the container for your reports based on the data you collect from your apps and sites.
A data stream lives within a property and is a source of data from your app or website.
Once you’ve identified a user base you’re trying to measure, create a property for that user base.
Then create a data stream for each of the ways these users interact with your business. For example, if you’re an app developer, you could create one data stream for your iOS app, one for your Android app, and one for your app’s marketing website.
Conversions are events that are assigned a value – such as a purchase, a lead or a download.
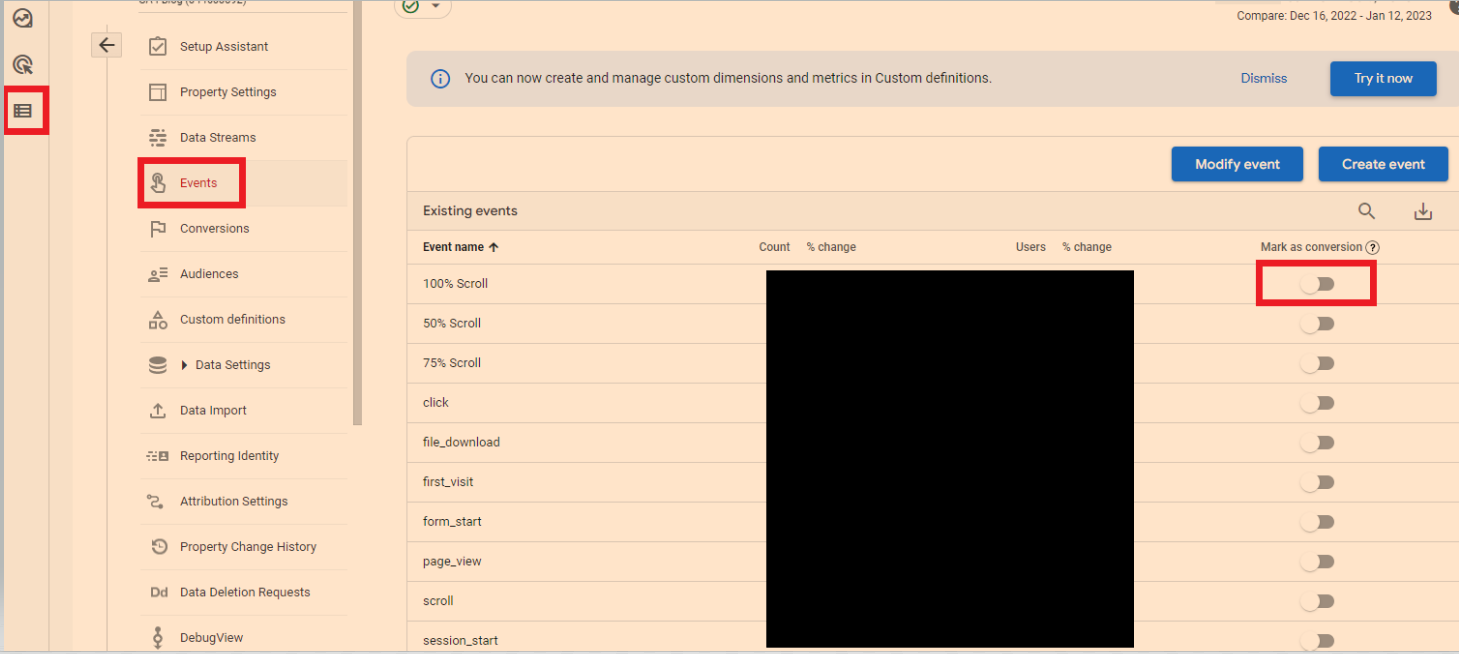
To mark events as conversions
In the left-hand side-menu, go to the bottom option “configure” – then “go to admin”
Click “events”
You can now turn on events like 100% scroll, to conversions.
Modelled Conversions
Browsers that don’t allow conversions to be measured with third-party cookies have conversions modeled based on a website’s traffic. Browsers that limit the time window for first-party cookies have conversions (beyond the window) modeled.
Some countries require consent to use cookies for advertising activities. When advertisers use consent mode, conversions are modeled for unconsented users.
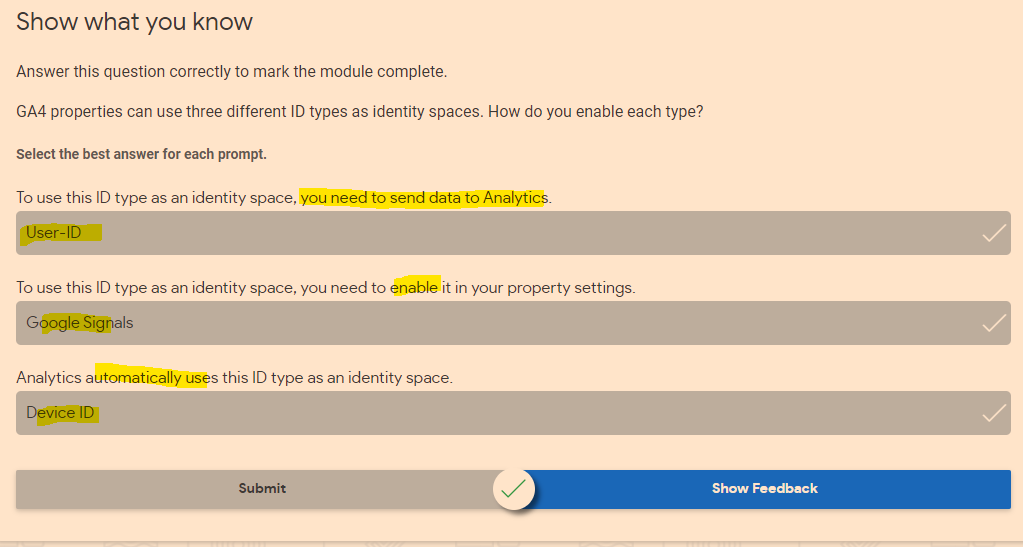
When trying to understand user journeys, Analytics can use several different user identifiers, such as the IDs you assign users logged into your website, Google signals, and device ID. These groups of identifiers are called identity spaces.
Reports & Explorations
Free From Exploration
The free form exploration allows you to visualize your data with flexibility and ease.
To conduct an ad hoc analysis, just drag and drop the variables you’re interested in onto a canvas to see instant visualizations of your data. Don’t see the variable you’re looking for? Select the plus icon to view the full list of dimensions and metrics you can use.
This tool presents your data in a cross-tab layout, where you can arrange the rows and columns as you like and add the metrics you’re most interested in. You can also apply different visualization styles, including bar charts, pie charts, line charts, scatter plots, and maps.
If you spot a significant data point, right-click on that data point to easily create an audience or segment from it and use it in other explorations. If you use the line chart visualization, you’ll see an automatic feature enabled called anomaly detection. This feature uses machine learning to identify outliers in your data according to your parameters.
Funnel Exploration
Funnel exploration lets you visualize the steps your users take toward a key task or conversion. This tool helps you identify sequences of key events and understand how your users navigate these steps. You’ll be able to see where users enter your funnels, as well as where they drop off.
You can use this information to improve your site or app and reduce inefficient or abandoned customer journeys. You can also easily create audiences of users based on where they enter or exit the funnels you define.
With this tool, you can define up to 10 steps in your funnels, up from five steps in UA properties’ Custom Funnels. Plus, you can now analyze both closed funnels (where users must enter at the beginning of the funnel) and open funnels (where users can enter the funnel at any point).
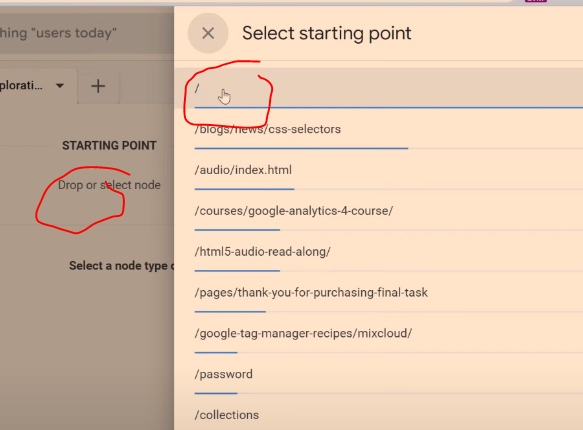
Path Exploration
Path exploration lets you understand how people progress from one stage in the customer journey to the next.
Like funnel exploration, path exploration uncovers the steps users take through your site or app. But while funnels only analyze a single, predefined path, path exploration is free-flowing and can follow any number of undefined paths, even ones you weren’t aware of or didn’t intend. For example, it could uncover looping behavior, which may indicate users becoming stuck.
Plus, you can define paths using either a starting point or an ending point. This helps you understand how users got to a certain step on their journey and shows you what they did after.
Segment Overlap
Segment overlap lets you compare up to three user segments to quickly see how those segments overlap and relate to each other. This can help you isolate specific audiences based on complex conditions. You can then create new segments based on your findings, which you can apply to other exploration techniques and Google Analytics reports.
Explorations are private by default. If you’re the creator, only you can view and edit them unless you choose to share.
Understand the Analytics property structure
You can use GA4 properties exclusively for web data, exclusively for app data, or for both app and web data together. No matter what your setup is, it’s important to understand how to structure your new Analytics property.
Introducing data streams
Data streams are a feature of GA4 properties that allow you to connect a single Analytics property to the various places where your users interact with your business. For example, a company that has both a website and an app would need a separate data stream for each platform to combine their reporting and insights into a single Analytics property.
Once you have set up your GA4 property and data stream(s), you can add different events.
For an eCommerce store, Google recommends setting up:
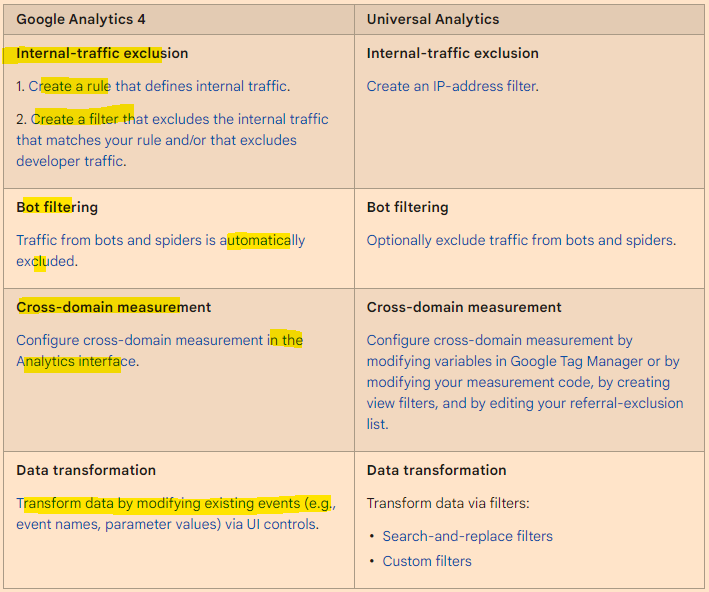
Google Analytics 4 filters are applied at the property level, and affect data from all data streams in that property. All reports for a property use the same filtered data.
Analytics collects and stores user interactions with your website or your app as events. Events provide insight into what’s happening on your website or app, such as page views, button clicks, user actions, or system events.
Conversions
It’s easy to create conversions, from events.
Got to EVENTS in the side-bar/menu on the left of GA4, then “All events”.
You can then mark existing events as conversions:
See also:
GA 4 SEO Reports – for step by step instructions on setting up some useful SEO reports in Google Analytics 4